California natural hazard risk by county
California has about $30.19 billion in modeled expected annual loss across 58 counties. The state accounts for 19.6% of the national modeled loss total. Its total ranks #1 among 56 state-level entries by modeled loss. FEMA published these 58 county estimates in its December 2025 National Risk Index. The modeled $30.19 billion annual average does not predict loss in any one year.
- Modeled expected annual loss
- $30.19 billion / year
- Share of US loss
- 19.6%
- State loss rank
- #1 of 56
- Largest modeled-loss hazard
- Earthquake
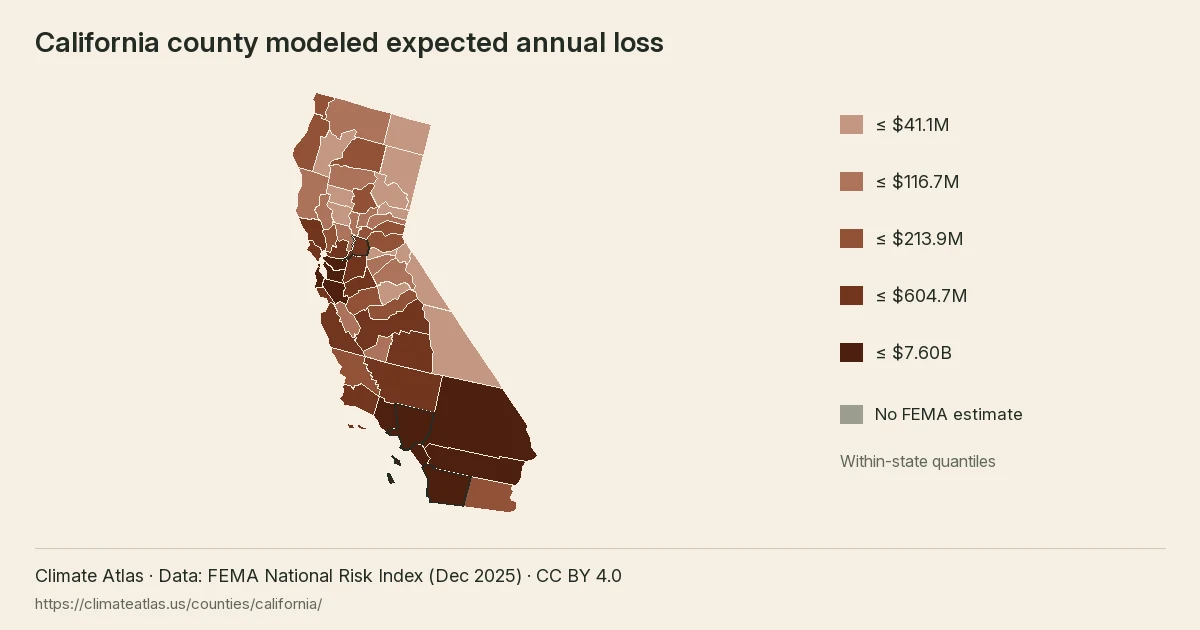
California county modeled loss
- Positive estimates to $41.1 million
- Above $41.1 million to $116.7 million
- Above $116.7 million to $213.9 million
- Above $213.9 million to $604.7 million
- Above $604.7 million to $7.60 billion
- No FEMA estimate
California counties use five within-state quantile classes of modeled expected annual loss. Darker rust means a larger estimate; outlined counties have detailed pages.
View chart data
| County | Modeled expected annual loss (USD/year) | Overall risk rating |
|---|---|---|
| San Benito County, CA | 80,008,768.66 | Relatively Moderate |
| Shasta County, CA | 135,490,377.52 | Relatively Moderate |
| Sierra County, CA | 8,418,251.38 | Very Low |
| Fresno County, CA | 557,308,876.71 | Relatively High |
| Amador County, CA | 38,826,327.08 | Relatively Low |
| El Dorado County, CA | 124,273,271.23 | Relatively Moderate |
| Monterey County, CA | 402,383,624.03 | Relatively High |
| San Bernardino County, CA | 2,075,099,788.96 | Very High |
| Tehama County, CA | 68,974,530.25 | Relatively Moderate |
| Nevada County, CA | 80,582,305.54 | Relatively Moderate |
| Tuolumne County, CA | 50,552,907.26 | Relatively Moderate |
| Santa Barbara County, CA | 477,257,073.51 | Relatively High |
| Trinity County, CA | 29,126,156.13 | Relatively Low |
| Stanislaus County, CA | 264,910,086.20 | Relatively High |
| Colusa County, CA | 40,632,839.85 | Relatively Moderate |
| Alpine County, CA | 4,785,307.09 | Very Low |
| Siskiyou County, CA | 56,992,092.16 | Relatively Moderate |
| Del Norte County, CA | 142,370,364.03 | Relatively High |
| Inyo County, CA | 28,320,123.39 | Relatively Low |
| San Joaquin County, CA | 421,872,900.01 | Relatively High |
| Imperial County, CA | 147,566,579.84 | Relatively High |
| Calaveras County, CA | 53,438,401.71 | Relatively Moderate |
| Butte County, CA | 127,169,961.72 | Relatively Moderate |
| Madera County, CA | 161,585,532.08 | Relatively High |
| Ventura County, CA | 762,169,091.27 | Relatively High |
| Orange County, CA | 1,926,466,710.37 | Very High |
| Kern County, CA | 416,967,444.00 | Relatively High |
| Contra Costa County, CA | 970,545,043.20 | Very High |
| Kings County, CA | 96,009,401.24 | Relatively Moderate |
| Mendocino County, CA | 116,713,328.86 | Relatively High |
| Sonoma County, CA | 604,686,271.65 | Relatively High |
| Yuba County, CA | 46,339,094.17 | Relatively Low |
| Merced County, CA | 204,766,057.18 | Relatively High |
| Tulare County, CA | 214,061,799.39 | Relatively High |
| Sacramento County, CA | 352,365,427.01 | Relatively High |
| Solano County, CA | 292,106,753.18 | Relatively High |
| San Francisco County, CA | 853,429,992.67 | Very High |
| Mariposa County, CA | 38,096,975.42 | Relatively Moderate |
| Marin County, CA | 259,347,945.20 | Relatively High |
| Sutter County, CA | 44,793,210.88 | Relatively Moderate |
| Lassen County, CA | 25,386,681.43 | Relatively Low |
| Riverside County, CA | 2,265,637,642.99 | Very High |
| Plumas County, CA | 41,063,082.82 | Relatively Moderate |
| Santa Clara County, CA | 1,965,273,927.89 | Very High |
| Placer County, CA | 162,559,842.92 | Relatively Moderate |
| San Luis Obispo County, CA | 213,915,950.48 | Relatively High |
| San Mateo County, CA | 739,963,779.16 | Relatively High |
| Mono County, CA | 16,685,128.45 | Relatively Low |
| San Diego County, CA | 1,539,181,273.08 | Very High |
| Napa County, CA | 186,047,671.47 | Relatively High |
| Alameda County, CA | 1,884,810,318.99 | Very High |
| Yolo County, CA | 116,239,526.87 | Relatively Moderate |
| Lake County, CA | 101,021,474.80 | Relatively Moderate |
| Los Angeles County, CA | 7,601,846,373.16 | Very High |
| Glenn County, CA | 40,918,946.54 | Relatively Low |
| Santa Cruz County, CA | 335,404,887.56 | Relatively High |
| Humboldt County, CA | 188,646,913.27 | Relatively High |
| Modoc County, CA | 9,805,827.27 | Very Low |
Reading the California county map
The map groups 58 county estimates into five within-state loss classes. Each boundary follows the county geography, while the fill represents modeled dollars per year. The class breaks are calculated from California county values, so a matching shade on another state page need not represent the same amount. Grey marks unmatched geography or an unavailable estimate. Outlined counties link to the detailed profiles available in this release; counties without profiles still contribute to the state totals.
Together, the three largest estimates account for 39.6% of California modeled annual loss. Their combined population represents 37.0% of the state source population. Comparing these two shares helps distinguish the concentration of modeled dollars from the concentration of residents. Neither share identifies the exposure of an individual address, and the map does not show the location of damage within a county.
Ten largest county loss estimates
Los Angeles County, CA has the largest modeled expected annual loss in this comparison, about $7.60 billion.
View chart data
| Place | USD / year |
|---|---|
| Los Angeles County, CA | 7,601,846,373.16 |
| Riverside County, CA | 2,265,637,642.99 |
| San Bernardino County, CA | 2,075,099,788.96 |
| Santa Clara County, CA | 1,965,273,927.89 |
| Orange County, CA | 1,926,466,710.37 |
| Alameda County, CA | 1,884,810,318.99 |
| San Diego County, CA | 1,539,181,273.08 |
| Contra Costa County, CA | 970,545,043.20 |
| San Francisco County, CA | 853,429,992.67 |
| Ventura County, CA | 762,169,091.27 |
County totals beside population
Los Angeles County, CA combines about $7.60 billion in modeled annual loss with 10,005,712 recorded residents. Dividing those figures gives about $760 per resident, compared with $764 statewide. On this population-adjusted measure, the county places #40 among the 58 state county records. This ratio spreads all modeled losses across residents for comparison; it is not a household bill, an insurance premium or an estimate of personal damage.
Riverside County, CA combines about $2.27 billion in modeled annual loss with 2,416,838 recorded residents. Dividing those figures gives about $937 per resident, compared with $764 statewide. On this population-adjusted measure, the county places #31 among the 58 state county records. This ratio spreads all modeled losses across residents for comparison; it is not a household bill, an insurance premium or an estimate of personal damage.
State hazard loss mix
Earthquake leads the modeled expected annual loss mix; bar lengths share a zero baseline.
View chart data
| Hazard | USD / year | Share |
|---|---|---|
| Earthquake | 14,853,246,588.21 | 49.2% |
| Riverine Flood | 11,662,338,119.36 | 38.6% |
| Wildfire | 1,787,365,372.48 | 5.9% |
| Drought | 1,001,607,226.26 | 3.3% |
| Heat Wave | 378,344,654.53 | 1.3% |
| Tsunami | 192,310,067.64 | 0.6% |
| Other | 319,709,270.59 | 1.1% |
San Bernardino County, CA combines about $2.08 billion in modeled annual loss with 2,179,979 recorded residents. Dividing those figures gives about $952 per resident, compared with $764 statewide. On this population-adjusted measure, the county places #30 among the 58 state county records. This ratio spreads all modeled losses across residents for comparison; it is not a household bill, an insurance premium or an estimate of personal damage.
Where the leading hazards are concentrated
For earthquakes, Los Angeles County, CA contributes 30.7% of the state hazard total. The next county, Alameda County, CA, contributes about $1.35 billion annually, compared with $4.57 billion for the leader. Across California, 58 county records have a positive modeled estimate for this hazard. The remaining counties together account for about $8.94 billion after those two leading estimates. The state places #1 of 56 state-level entries for this hazard. Its share of the state loss mix is 49.2%. These comparisons describe modeled losses rather than future events.
County hazard rating counts
- Very Low
- Relatively Low
- Relatively Moderate
- Relatively High
- Very High
- No rating
California has 58 county records in each row. Each bar shows the FEMA risk rating distribution for one of the three largest modeled-loss hazards.
View chart data
| Hazard | Rating | Count |
|---|---|---|
| Earthquake | Very Low | 1 |
| Earthquake | Relatively Low | 11 |
| Earthquake | Relatively Moderate | 19 |
| Earthquake | Relatively High | 20 |
| Earthquake | Very High | 7 |
| Earthquake | No rating | 0 |
| Riverine Flood | Very Low | 1 |
| Riverine Flood | Relatively Low | 10 |
| Riverine Flood | Relatively Moderate | 14 |
| Riverine Flood | Relatively High | 24 |
| Riverine Flood | Very High | 9 |
| Riverine Flood | No rating | 0 |
| Wildfire | Very Low | 1 |
| Wildfire | Relatively Low | 6 |
| Wildfire | Relatively Moderate | 21 |
| Wildfire | Relatively High | 26 |
| Wildfire | Very High | 4 |
| Wildfire | No rating | 0 |
For riverine flooding, Los Angeles County, CA contributes 24.1% of the state hazard total. The next county, Riverside County, CA, contributes about $1.13 billion annually, compared with $2.81 billion for the leader. Across California, 58 county records have a positive modeled estimate for this hazard. The remaining counties together account for about $7.73 billion after those two leading estimates. The state places #1 of 56 state-level entries for this hazard. Its share of the state loss mix is 38.6%. These comparisons describe modeled losses rather than future events.
For wildfires, San Diego County, CA contributes 24.1% of the state hazard total. The next county, Riverside County, CA, contributes about $346.6 million annually, compared with $430.2 million for the leader. Across California, 58 county records have a positive modeled estimate for this hazard. The remaining counties together account for about $1.01 billion after those two leading estimates. The state places #1 of 56 state-level entries for this hazard. Its share of the state loss mix is 5.9%. These comparisons describe modeled losses rather than future events.
For drought, Fresno County, CA contributes 22.3% of the state hazard total. The next county, San Joaquin County, CA, contributes about $83.3 million annually, compared with $222.9 million for the leader. Across California, 55 county records have a positive modeled estimate for this hazard. The remaining counties together account for about $695.4 million after those two leading estimates. The state places #1 of 56 state-level entries for this hazard. Its share of the state loss mix is 3.3%. These comparisons describe modeled losses rather than future events.
For heat waves, Kern County, CA contributes 11.2% of the state hazard total. The next county, Los Angeles County, CA, contributes about $36.8 million annually, compared with $42.5 million for the leader. Across California, 58 county records have a positive modeled estimate for this hazard. The remaining counties together account for about $299.0 million after those two leading estimates. The state places #4 of 56 state-level entries for this hazard. Its share of the state loss mix is 1.3%. These comparisons describe modeled losses rather than future events.
For tsunamis, Del Norte County, CA contributes 59.4% of the state hazard total. The next county, Humboldt County, CA, contributes about $33.4 million annually, compared with $114.2 million for the leader. Across California, 20 county records have a positive modeled estimate for this hazard. The remaining counties together account for about $44.7 million after those two leading estimates. The state places #4 of 56 state-level entries for this hazard. Its share of the state loss mix is 0.6%. These comparisons describe modeled losses rather than future events.
California hazard totals and county comparisons
| Hazard | Modeled annual loss | State share | VH / RH counties | Largest county | US state rank |
|---|---|---|---|---|---|
| Earthquake | $14.85 billion | 49.2% | 7 / 20 | Los Angeles County, CA | #1 of 56 |
| Riverine Flood | $11.66 billion | 38.6% | 9 / 24 | Los Angeles County, CA | #1 of 56 |
| Wildfire | $1.79 billion | 5.9% | 4 / 26 | San Diego County, CA | #1 of 56 |
| Drought | $1.00 billion | 3.3% | 14 / 18 | Fresno County, CA | #1 of 56 |
| Heat Wave | $378.3 million | 1.3% | 0 / 17 | Kern County, CA | #4 of 56 |
| Tsunami | $192.3 million | 0.6% | 1 / 1 | Del Norte County, CA | #4 of 56 |
| Landslide | $130.1 million | 0.4% | 2 / 27 | Santa Barbara County, CA | #2 of 56 |
| Coastal Flood | $67.3 million | 0.2% | 1 / 7 | Marin County, CA | #5 of 56 |
| Tornado | $54.5 million | 0.2% | 0 / 1 | Los Angeles County, CA | #29 of 56 |
| Lightning | $25.8 million | 0.1% | 1 / 9 | Los Angeles County, CA | #26 of 56 |
| Hail | $16.3 million | 0.1% | 0 / 1 | Fresno County, CA | #28 of 56 |
| Strong Wind | $12.5 million | 0.0% | 0 / 1 | San Bernardino County, CA | #37 of 56 |
| Avalanche | $6.7 million | 0.0% | 2 / 8 | Placer County, CA | #7 of 56 |
| Winter Weather | $3.4 million | 0.0% | 0 / 3 | Calaveras County, CA | #37 of 56 |
| Volcanic Activity | $2.4 million | 0.0% | 0 / 1 | Siskiyou County, CA | #4 of 56 |
| Cold Wave | $705,000 | 0.0% | 0 / 0 | San Bernardino County, CA | #50 of 56 |
| Hurricane | $9,000 | 0.0% | 0 / 0 | Imperial County, CA | #43 of 56 |
Hazard shares show which modeled expected annual losses dominate the state total; ranks compare state totals for the same hazard.
California hazard totals combine the county estimates. The largest county column identifies concentration within each hazard; the state rank compares the same hazard across state-level entries.
California county loss totals
| County | Risk index rating | Modeled annual loss | Largest hazard |
|---|---|---|---|
| Los Angeles County | Very High | $7.60 billion | Earthquake |
| Riverside County | Very High | $2.27 billion | Riverine Flood |
| San Bernardino County | Very High | $2.08 billion | Riverine Flood |
| Santa Clara County | Very High | $1.97 billion | Earthquake |
| Orange County | Very High | $1.93 billion | Earthquake |
| Alameda County | Very High | $1.88 billion | Earthquake |
| San Diego County | Very High | $1.54 billion | Riverine Flood |
| Contra Costa County | Very High | $970.5 million | Earthquake |
| San Francisco County | Very High | $853.4 million | Earthquake |
| Ventura County | Relatively High | $762.2 million | Earthquake |
| San Mateo County | Relatively High | $740.0 million | Earthquake |
| Sonoma County | Relatively High | $604.7 million | Earthquake |
| Fresno County | Relatively High | $557.3 million | Drought |
| Santa Barbara County | Relatively High | $477.3 million | Earthquake |
| San Joaquin County | Relatively High | $421.9 million | Earthquake |
Show all 58 counties
| County | Risk index rating | Modeled annual loss | Largest hazard |
|---|---|---|---|
| Kern County | Relatively High | $417.0 million | Earthquake |
| Monterey County | Relatively High | $402.4 million | Earthquake |
| Sacramento County | Relatively High | $352.4 million | Riverine Flood |
| Santa Cruz County | Relatively High | $335.4 million | Earthquake |
| Solano County | Relatively High | $292.1 million | Riverine Flood |
| Stanislaus County | Relatively High | $264.9 million | Riverine Flood |
| Marin County | Relatively High | $259.3 million | Riverine Flood |
| Tulare County | Relatively High | $214.1 million | Riverine Flood |
| San Luis Obispo County | Relatively High | $213.9 million | Riverine Flood |
| Merced County | Relatively High | $204.8 million | Drought |
| Humboldt County | Relatively High | $188.6 million | Earthquake |
| Napa County | Relatively High | $186.0 million | Riverine Flood |
| Placer County | Relatively Moderate | $162.6 million | Riverine Flood |
| Madera County | Relatively High | $161.6 million | Drought |
| Imperial County | Relatively High | $147.6 million | Earthquake |
| Del Norte County | Relatively High | $142.4 million | Tsunami |
| Shasta County | Relatively Moderate | $135.5 million | Riverine Flood |
| Butte County | Relatively Moderate | $127.2 million | Riverine Flood |
| El Dorado County | Relatively Moderate | $124.3 million | Riverine Flood |
| Mendocino County | Relatively High | $116.7 million | Riverine Flood |
| Yolo County | Relatively Moderate | $116.2 million | Riverine Flood |
| Lake County | Relatively Moderate | $101.0 million | Riverine Flood |
| Kings County | Relatively Moderate | $96.0 million | Drought |
| Nevada County | Relatively Moderate | $80.6 million | Riverine Flood |
| San Benito County | Relatively Moderate | $80.0 million | Earthquake |
| Tehama County | Relatively Moderate | $69.0 million | Riverine Flood |
| Siskiyou County | Relatively Moderate | $57.0 million | Riverine Flood |
| Calaveras County | Relatively Moderate | $53.4 million | Wildfire |
| Tuolumne County | Relatively Moderate | $50.6 million | Wildfire |
| Yuba County | Relatively Low | $46.3 million | Riverine Flood |
| Sutter County | Relatively Moderate | $44.8 million | Drought |
| Plumas County | Relatively Moderate | $41.1 million | Riverine Flood |
| Glenn County | Relatively Low | $40.9 million | Drought |
| Colusa County | Relatively Moderate | $40.6 million | Drought |
| Amador County | Relatively Low | $38.8 million | Wildfire |
| Mariposa County | Relatively Moderate | $38.1 million | Wildfire |
| Trinity County | Relatively Low | $29.1 million | Riverine Flood |
| Inyo County | Relatively Low | $28.3 million | Heat Wave |
| Lassen County | Relatively Low | $25.4 million | Riverine Flood |
| Mono County | Relatively Low | $16.7 million | Riverine Flood |
| Modoc County | Very Low | $9.8 million | Riverine Flood |
| Sierra County | Very Low | $8.4 million | Riverine Flood |
| Alpine County | Very Low | $4.8 million | Avalanche |
California population, values and ratings
- Population
- 39,501,350
- Building value
- $7,743.81 billion
- Agricultural value
- $58.14 billion
- Modeled loss per resident
- $764
Overall county risk ratings
- Very Low: 3
- Relatively Low: 7
- Relatively Moderate: 17
- Relatively High: 22
- Very High: 9
California overall ratings describe relative county risk. Segment widths count counties, rather than residents or modeled dollars.
View chart data
| Rating | Count |
|---|---|
| Very Low | 3 |
| Relatively Low | 7 |
| Relatively Moderate | 17 |
| Relatively High | 22 |
| Very High | 9 |
California county pages
California has 3 detailed county pages linked below.
Questions about California
Which California county has the largest modeled loss?
Los Angeles County, CA leads California, with about $7.60 billion in modeled expected annual loss.
Which hazard leads modeled loss in California?
Earthquakes leads California, at about $14.85 billion annually.
What total loss does FEMA model for California?
California has about $30.19 billion in modeled expected annual loss.
What share of national loss belongs to California?
The state accounts for 19.6% of national modeled loss.
How many counties appear in the California table?
The California table contains 58 counties and county equivalents.
Where does California rank by modeled loss?
California places #1 of 56 state-level entries by modeled expected annual loss.
Does the California estimate predict next year?
The California figure is a long-run modeled annual average, rather than a forecast for any single year.
California county modeled expected annual loss, in five within-state quantile classes.