Florida natural hazard risk by county
Florida has about $8.79 billion in modeled expected annual loss across 67 counties. The state accounts for 5.7% of the national modeled loss total. Its total ranks #3 among 56 state-level entries by modeled loss. FEMA published these 67 county estimates in its December 2025 National Risk Index. The modeled $8.79 billion annual average does not predict loss in any one year.
- Modeled expected annual loss
- $8.79 billion / year
- Share of US loss
- 5.7%
- State loss rank
- #3 of 56
- Largest modeled-loss hazard
- Hurricane
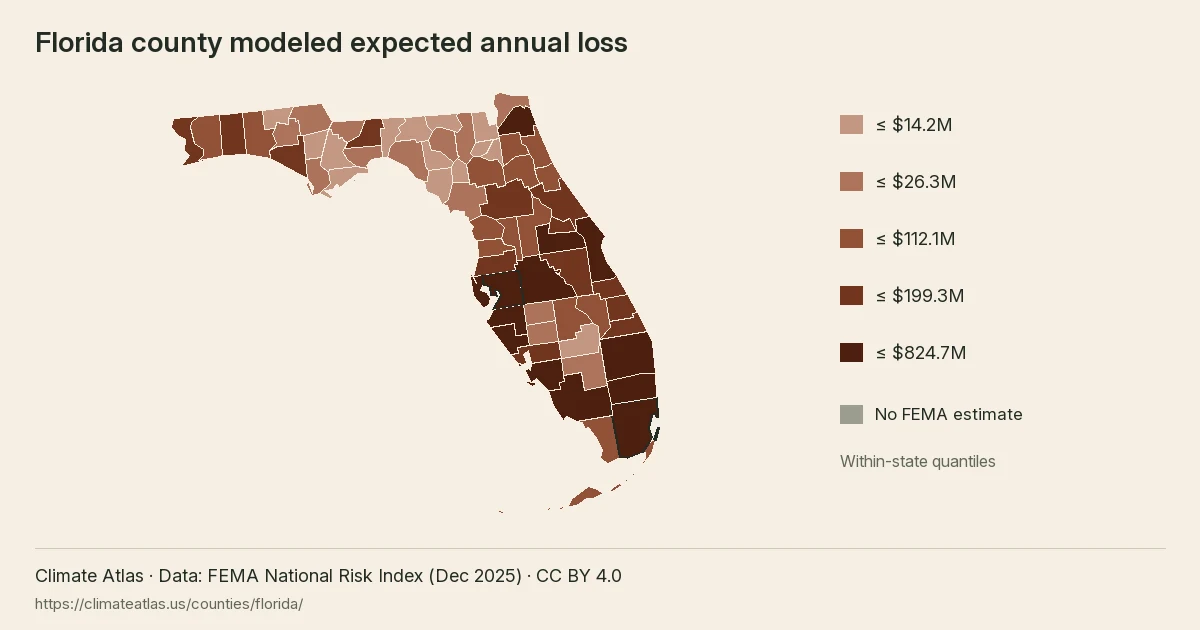
Florida county modeled loss
- Positive estimates to $14.2 million
- Above $14.2 million to $26.3 million
- Above $26.3 million to $112.1 million
- Above $112.1 million to $199.3 million
- Above $199.3 million to $824.7 million
- No FEMA estimate
Florida counties use five within-state quantile classes of modeled expected annual loss. Darker rust means a larger estimate; outlined counties have detailed pages.
View chart data
| County | Modeled expected annual loss (USD/year) | Overall risk rating |
|---|---|---|
| Okaloosa County, FL | 134,474,574.37 | Relatively Moderate |
| Glades County, FL | 8,835,438.68 | Relatively Low |
| DeSoto County, FL | 26,272,412.12 | Relatively Moderate |
| Dixie County, FL | 9,427,293.81 | Very Low |
| Martin County, FL | 119,366,014.74 | Relatively Moderate |
| Hardee County, FL | 25,430,643.56 | Relatively Low |
| Bay County, FL | 157,915,659.28 | Relatively Moderate |
| Flagler County, FL | 41,647,547.16 | Relatively Moderate |
| Orange County, FL | 417,684,854.23 | Relatively High |
| Walton County, FL | 68,446,444.23 | Relatively Moderate |
| Pasco County, FL | 199,309,461.28 | Relatively High |
| St. Lucie County, FL | 193,428,647.76 | Relatively High |
| Washington County, FL | 18,509,356.46 | Relatively Low |
| Sumter County, FL | 46,145,350.99 | Relatively Moderate |
| Palm Beach County, FL | 518,587,102.20 | Relatively High |
| Alachua County, FL | 89,623,349.83 | Relatively Moderate |
| Lafayette County, FL | 5,583,300.51 | Very Low |
| Okeechobee County, FL | 26,558,434.69 | Relatively Low |
| Hernando County, FL | 60,139,645.24 | Relatively Moderate |
| Charlotte County, FL | 131,299,370.28 | Relatively High |
| Lee County, FL | 433,307,086.14 | Relatively High |
| Lake County, FL | 102,252,671.32 | Relatively Moderate |
| Suwannee County, FL | 24,514,724.60 | Relatively Low |
| Levy County, FL | 15,295,946.68 | Relatively Low |
| Nassau County, FL | 24,509,256.38 | Relatively Low |
| Madison County, FL | 10,745,564.64 | Relatively Low |
| Columbia County, FL | 21,927,354.02 | Relatively Low |
| Calhoun County, FL | 10,624,504.28 | Relatively Low |
| Citrus County, FL | 112,090,078.73 | Relatively High |
| Franklin County, FL | 11,157,714.21 | Relatively Low |
| Gadsden County, FL | 19,335,539.51 | Relatively Low |
| Gulf County, FL | 17,330,659.38 | Relatively Low |
| Jefferson County, FL | 7,262,265.39 | Very Low |
| Pinellas County, FL | 303,434,178.68 | Relatively High |
| Clay County, FL | 57,125,297.26 | Relatively Moderate |
| Santa Rosa County, FL | 101,239,305.88 | Relatively Moderate |
| Seminole County, FL | 129,220,829.71 | Relatively Moderate |
| Volusia County, FL | 195,696,118.96 | Relatively High |
| Monroe County, FL | 93,252,682.69 | Relatively Moderate |
| St. Johns County, FL | 96,985,251.44 | Relatively Moderate |
| Osceola County, FL | 117,615,260.15 | Relatively Moderate |
| Sarasota County, FL | 273,027,730.62 | Relatively High |
| Gilchrist County, FL | 6,826,941.85 | Very Low |
| Hendry County, FL | 22,413,506.89 | Relatively Low |
| Highlands County, FL | 46,656,668.65 | Relatively Moderate |
| Indian River County, FL | 163,113,851.49 | Relatively High |
| Manatee County, FL | 254,683,438.05 | Relatively High |
| Union County, FL | 4,968,231.63 | Very Low |
| Duval County, FL | 263,916,601.02 | Relatively High |
| Wakulla County, FL | 18,936,508.79 | Relatively Low |
| Jackson County, FL | 25,327,887.54 | Relatively Low |
| Leon County, FL | 142,710,674.85 | Relatively Moderate |
| Escambia County, FL | 173,708,769.51 | Relatively High |
| Miami-Dade County, FL | 824,686,737.26 | Very High |
| Bradford County, FL | 10,772,907.09 | Very Low |
| Taylor County, FL | 16,197,007.92 | Relatively Low |
| Broward County, FL | 647,973,333.43 | Relatively High |
| Polk County, FL | 212,568,295.75 | Relatively High |
| Brevard County, FL | 389,320,976.96 | Relatively High |
| Hamilton County, FL | 8,575,735.74 | Relatively Low |
| Collier County, FL | 398,236,266.95 | Relatively High |
| Baker County, FL | 6,286,133.68 | Very Low |
| Liberty County, FL | 4,809,251.60 | Very Low |
| Holmes County, FL | 14,201,693.43 | Relatively Low |
| Putnam County, FL | 29,385,123.30 | Relatively Low |
| Marion County, FL | 128,387,986.24 | Relatively High |
| Hillsborough County, FL | 494,579,509.61 | Relatively High |
Reading the Florida county map
The map groups 67 county estimates into five within-state loss classes. Each boundary follows the county geography, while the fill represents modeled dollars per year. The class breaks are calculated from Florida county values, so a matching shade on another state page need not represent the same amount. Grey marks unmatched geography or an unavailable estimate. Outlined counties link to the detailed profiles available in this release; counties without profiles still contribute to the state totals.
Together, the three largest estimates account for 22.7% of Florida modeled annual loss. Their combined population represents 28.5% of the state source population. Comparing these two shares helps distinguish the concentration of modeled dollars from the concentration of residents. Neither share identifies the exposure of an individual address, and the map does not show the location of damage within a county.
Ten largest county loss estimates
Miami-Dade County, FL has the largest modeled expected annual loss in this comparison, about $824.7 million.
View chart data
| Place | USD / year |
|---|---|
| Miami-Dade County, FL | 824,686,737.26 |
| Broward County, FL | 647,973,333.43 |
| Palm Beach County, FL | 518,587,102.20 |
| Hillsborough County, FL | 494,579,509.61 |
| Lee County, FL | 433,307,086.14 |
| Orange County, FL | 417,684,854.23 |
| Collier County, FL | 398,236,266.95 |
| Brevard County, FL | 389,320,976.96 |
| Pinellas County, FL | 303,434,178.68 |
| Sarasota County, FL | 273,027,730.62 |
County totals beside population
Miami-Dade County, FL combines about $824.7 million in modeled annual loss with 2,698,679 recorded residents. Dividing those figures gives about $306 per resident, compared with $409 statewide. On this population-adjusted measure, the county places #58 among the 67 state county records. This ratio spreads all modeled losses across residents for comparison; it is not a household bill, an insurance premium or an estimate of personal damage.
Broward County, FL combines about $648.0 million in modeled annual loss with 1,940,829 recorded residents. Dividing those figures gives about $334 per resident, compared with $409 statewide. On this population-adjusted measure, the county places #52 among the 67 state county records. This ratio spreads all modeled losses across residents for comparison; it is not a household bill, an insurance premium or an estimate of personal damage.
State hazard loss mix
Hurricane leads the modeled expected annual loss mix; bar lengths share a zero baseline.
View chart data
| Hazard | USD / year | Share |
|---|---|---|
| Hurricane | 4,277,265,866.57 | 48.7% |
| Riverine Flood | 2,781,288,362.08 | 31.7% |
| Tornado | 529,539,231.25 | 6.0% |
| Cold Wave | 336,192,376.53 | 3.8% |
| Coastal Flood | 201,416,698.37 | 2.3% |
| Heat Wave | 164,892,520.46 | 1.9% |
| Other | 495,283,918.37 | 5.6% |
Palm Beach County, FL combines about $518.6 million in modeled annual loss with 1,489,461 recorded residents. Dividing those figures gives about $348 per resident, compared with $409 statewide. On this population-adjusted measure, the county places #49 among the 67 state county records. This ratio spreads all modeled losses across residents for comparison; it is not a household bill, an insurance premium or an estimate of personal damage.
Where the leading hazards are concentrated
For hurricanes, Miami-Dade County, FL contributes 7.7% of the state hazard total. The next county, Lee County, FL, contributes about $300.4 million annually, compared with $330.6 million for the leader. Across Florida, 67 county records have a positive modeled estimate for this hazard. The remaining counties together account for about $3.65 billion after those two leading estimates. The state places #1 of 56 state-level entries for this hazard. Its share of the state loss mix is 48.7%. These comparisons describe modeled losses rather than future events.
County hazard rating counts
- Very Low
- Relatively Low
- Relatively Moderate
- Relatively High
- Very High
- No rating
Florida has 67 county records in each row. Each bar shows the FEMA risk rating distribution for one of the three largest modeled-loss hazards.
View chart data
| Hazard | Rating | Count |
|---|---|---|
| Hurricane | Very Low | 0 |
| Hurricane | Relatively Low | 2 |
| Hurricane | Relatively Moderate | 21 |
| Hurricane | Relatively High | 23 |
| Hurricane | Very High | 21 |
| Hurricane | No rating | 0 |
| Riverine Flood | Very Low | 16 |
| Riverine Flood | Relatively Low | 13 |
| Riverine Flood | Relatively Moderate | 23 |
| Riverine Flood | Relatively High | 13 |
| Riverine Flood | Very High | 2 |
| Riverine Flood | No rating | 0 |
| Tornado | Very Low | 3 |
| Tornado | Relatively Low | 24 |
| Tornado | Relatively Moderate | 17 |
| Tornado | Relatively High | 20 |
| Tornado | Very High | 3 |
| Tornado | No rating | 0 |
For riverine flooding, Miami-Dade County, FL contributes 12.8% of the state hazard total. The next county, Broward County, FL, contributes about $289.0 million annually, compared with $355.8 million for the leader. Across Florida, 67 county records have a positive modeled estimate for this hazard. The remaining counties together account for about $2.14 billion after those two leading estimates. The state places #5 of 56 state-level entries for this hazard. Its share of the state loss mix is 31.7%. These comparisons describe modeled losses rather than future events.
For tornadoes, Hillsborough County, FL contributes 14.5% of the state hazard total. The next county, Orange County, FL, contributes about $45.4 million annually, compared with $76.8 million for the leader. Across Florida, 67 county records have a positive modeled estimate for this hazard. The remaining counties together account for about $407.3 million after those two leading estimates. The state places #3 of 56 state-level entries for this hazard. Its share of the state loss mix is 6.0%. These comparisons describe modeled losses rather than future events.
For cold waves, Hillsborough County, FL contributes 16.2% of the state hazard total. The next county, Orange County, FL, contributes about $48.1 million annually, compared with $54.4 million for the leader. Across Florida, 67 county records have a positive modeled estimate for this hazard. The remaining counties together account for about $233.6 million after those two leading estimates. The state places #7 of 56 state-level entries for this hazard. Its share of the state loss mix is 3.8%. These comparisons describe modeled losses rather than future events.
For coastal flooding, Pinellas County, FL contributes 12.2% of the state hazard total. The next county, Miami-Dade County, FL, contributes about $22.8 million annually, compared with $24.6 million for the leader. Across Florida, 47 county records have a positive modeled estimate for this hazard. The remaining counties together account for about $154.0 million after those two leading estimates. The state places #1 of 56 state-level entries for this hazard. Its share of the state loss mix is 2.3%. These comparisons describe modeled losses rather than future events.
For heat waves, Miami-Dade County, FL contributes 18.9% of the state hazard total. The next county, Broward County, FL, contributes about $20.5 million annually, compared with $31.1 million for the leader. Across Florida, 67 county records have a positive modeled estimate for this hazard. The remaining counties together account for about $113.3 million after those two leading estimates. The state places #10 of 56 state-level entries for this hazard. Its share of the state loss mix is 1.9%. These comparisons describe modeled losses rather than future events.
Florida hazard totals and county comparisons
| Hazard | Modeled annual loss | State share | VH / RH counties | Largest county | US state rank |
|---|---|---|---|---|---|
| Hurricane | $4.28 billion | 48.7% | 21 / 23 | Miami-Dade County, FL | #1 of 56 |
| Riverine Flood | $2.78 billion | 31.7% | 2 / 13 | Miami-Dade County, FL | #5 of 56 |
| Tornado | $529.5 million | 6.0% | 3 / 20 | Hillsborough County, FL | #3 of 56 |
| Cold Wave | $336.2 million | 3.8% | 5 / 5 | Hillsborough County, FL | #7 of 56 |
| Coastal Flood | $201.4 million | 2.3% | 7 / 9 | Pinellas County, FL | #1 of 56 |
| Heat Wave | $164.9 million | 1.9% | 0 / 5 | Miami-Dade County, FL | #10 of 56 |
| Strong Wind | $163.1 million | 1.9% | 6 / 12 | Orange County, FL | #4 of 56 |
| Lightning | $161.9 million | 1.8% | 24 / 23 | Broward County, FL | #1 of 56 |
| Wildfire | $111.8 million | 1.3% | 0 / 0 | Orange County, FL | #11 of 56 |
| Hail | $26.0 million | 0.3% | 0 / 5 | Orange County, FL | #23 of 56 |
| Earthquake | $20.7 million | 0.2% | 0 / 0 | Duval County, FL | #41 of 56 |
| Drought | $10.9 million | 0.1% | 0 / 1 | Palm Beach County, FL | #27 of 56 |
| Winter Weather | $469,000 | 0.0% | 0 / 0 | Escambia County, FL | #49 of 56 |
| Ice Storm | $246,000 | 0.0% | 0 / 0 | Nassau County, FL | #47 of 56 |
| Landslide | $54,000 | 0.0% | 0 / 0 | Palm Beach County, FL | #47 of 56 |
Hazard shares show which modeled expected annual losses dominate the state total; ranks compare state totals for the same hazard.
Florida hazard totals combine the county estimates. The largest county column identifies concentration within each hazard; the state rank compares the same hazard across state-level entries.
Florida county loss totals
| County | Risk index rating | Modeled annual loss | Largest hazard |
|---|---|---|---|
| Miami-Dade County | Very High | $824.7 million | Riverine Flood |
| Broward County | Relatively High | $648.0 million | Riverine Flood |
| Palm Beach County | Relatively High | $518.6 million | Hurricane |
| Hillsborough County | Relatively High | $494.6 million | Hurricane |
| Lee County | Relatively High | $433.3 million | Hurricane |
| Orange County | Relatively High | $417.7 million | Riverine Flood |
| Collier County | Relatively High | $398.2 million | Hurricane |
| Brevard County | Relatively High | $389.3 million | Hurricane |
| Pinellas County | Relatively High | $303.4 million | Hurricane |
| Sarasota County | Relatively High | $273.0 million | Hurricane |
| Duval County | Relatively High | $263.9 million | Riverine Flood |
| Manatee County | Relatively High | $254.7 million | Hurricane |
| Polk County | Relatively High | $212.6 million | Hurricane |
| Pasco County | Relatively High | $199.3 million | Hurricane |
| Volusia County | Relatively High | $195.7 million | Hurricane |
Show all 67 counties
| County | Risk index rating | Modeled annual loss | Largest hazard |
|---|---|---|---|
| St. Lucie County | Relatively High | $193.4 million | Hurricane |
| Escambia County | Relatively High | $173.7 million | Hurricane |
| Indian River County | Relatively High | $163.1 million | Hurricane |
| Bay County | Relatively Moderate | $157.9 million | Hurricane |
| Leon County | Relatively Moderate | $142.7 million | Riverine Flood |
| Okaloosa County | Relatively Moderate | $134.5 million | Hurricane |
| Charlotte County | Relatively High | $131.3 million | Hurricane |
| Seminole County | Relatively Moderate | $129.2 million | Riverine Flood |
| Marion County | Relatively High | $128.4 million | Hurricane |
| Martin County | Relatively Moderate | $119.4 million | Hurricane |
| Osceola County | Relatively Moderate | $117.6 million | Riverine Flood |
| Citrus County | Relatively High | $112.1 million | Hurricane |
| Lake County | Relatively Moderate | $102.3 million | Riverine Flood |
| Santa Rosa County | Relatively Moderate | $101.2 million | Hurricane |
| St. Johns County | Relatively Moderate | $97.0 million | Riverine Flood |
| Monroe County | Relatively Moderate | $93.3 million | Hurricane |
| Alachua County | Relatively Moderate | $89.6 million | Riverine Flood |
| Walton County | Relatively Moderate | $68.4 million | Hurricane |
| Hernando County | Relatively Moderate | $60.1 million | Hurricane |
| Clay County | Relatively Moderate | $57.1 million | Riverine Flood |
| Highlands County | Relatively Moderate | $46.7 million | Hurricane |
| Sumter County | Relatively Moderate | $46.1 million | Hurricane |
| Flagler County | Relatively Moderate | $41.6 million | Hurricane |
| Putnam County | Relatively Low | $29.4 million | Riverine Flood |
| Okeechobee County | Relatively Low | $26.6 million | Riverine Flood |
| DeSoto County | Relatively Moderate | $26.3 million | Hurricane |
| Hardee County | Relatively Low | $25.4 million | Strong Wind |
| Jackson County | Relatively Low | $25.3 million | Hurricane |
| Suwannee County | Relatively Low | $24.5 million | Hurricane |
| Nassau County | Relatively Low | $24.5 million | Riverine Flood |
| Hendry County | Relatively Low | $22.4 million | Hurricane |
| Columbia County | Relatively Low | $21.9 million | Riverine Flood |
| Gadsden County | Relatively Low | $19.3 million | Hurricane |
| Wakulla County | Relatively Low | $18.9 million | Riverine Flood |
| Washington County | Relatively Low | $18.5 million | Hurricane |
| Gulf County | Relatively Low | $17.3 million | Hurricane |
| Taylor County | Relatively Low | $16.2 million | Hurricane |
| Levy County | Relatively Low | $15.3 million | Hurricane |
| Holmes County | Relatively Low | $14.2 million | Hurricane |
| Franklin County | Relatively Low | $11.2 million | Hurricane |
| Bradford County | Very Low | $10.8 million | Hurricane |
| Madison County | Relatively Low | $10.7 million | Hurricane |
| Calhoun County | Relatively Low | $10.6 million | Hurricane |
| Dixie County | Very Low | $9.4 million | Hurricane |
| Glades County | Relatively Low | $8.8 million | Riverine Flood |
| Hamilton County | Relatively Low | $8.6 million | Hurricane |
| Jefferson County | Very Low | $7.3 million | Hurricane |
| Gilchrist County | Very Low | $6.8 million | Riverine Flood |
| Baker County | Very Low | $6.3 million | Riverine Flood |
| Lafayette County | Very Low | $5.6 million | Hurricane |
| Union County | Very Low | $5.0 million | Hurricane |
| Liberty County | Very Low | $4.8 million | Hurricane |
Florida population, values and ratings
- Population
- 21,506,751
- Building value
- $3,652.27 billion
- Agricultural value
- $9.47 billion
- Modeled loss per resident
- $409
Overall county risk ratings
- Very Low: 8
- Relatively Low: 20
- Relatively Moderate: 18
- Relatively High: 20
- Very High: 1
Florida overall ratings describe relative county risk. Segment widths count counties, rather than residents or modeled dollars.
View chart data
| Rating | Count |
|---|---|
| Very Low | 8 |
| Relatively Low | 20 |
| Relatively Moderate | 18 |
| Relatively High | 20 |
| Very High | 1 |
Florida county pages
Florida has 2 detailed county pages linked below.
Questions about Florida
Which Florida county has the largest modeled loss?
Miami-Dade County, FL leads Florida, with about $824.7 million in modeled expected annual loss.
Which hazard leads modeled loss in Florida?
Hurricanes leads Florida, at about $4.28 billion annually.
What total loss does FEMA model for Florida?
Florida has about $8.79 billion in modeled expected annual loss.
What share of national loss belongs to Florida?
The state accounts for 5.7% of national modeled loss.
How many counties appear in the Florida table?
The Florida table contains 67 counties and county equivalents.
Where does Florida rank by modeled loss?
Florida places #3 of 56 state-level entries by modeled expected annual loss.
Does the Florida estimate predict next year?
The Florida figure is a long-run modeled annual average, rather than a forecast for any single year.
Florida county modeled expected annual loss, in five within-state quantile classes.