Michigan natural hazard risk by county
Michigan has about $2.85 billion in modeled expected annual loss across 83 counties. The state accounts for 1.9% of the national modeled loss total. Its total ranks #18 among 56 state-level entries by modeled loss. FEMA published these 83 county estimates in its December 2025 National Risk Index. The modeled $2.85 billion annual average does not predict loss in any one year.
- Modeled expected annual loss
- $2.85 billion / year
- Share of US loss
- 1.9%
- State loss rank
- #18 of 56
- Largest modeled-loss hazard
- Riverine Flood
Michigan county modeled loss
- Positive estimates to $6.4 million
- Above $6.4 million to $11.2 million
- Above $11.2 million to $19.5 million
- Above $19.5 million to $34.5 million
- Above $34.5 million to $401.5 million
- No FEMA estimate
Michigan counties use five within-state quantile classes of modeled expected annual loss. Darker rust means a larger estimate; outlined counties have detailed pages.
View chart data
| County | Modeled expected annual loss (USD/year) | Overall risk rating |
|---|---|---|
| Lapeer County, MI | 28,023,204.36 | Relatively Low |
| Newaygo County, MI | 13,221,035.51 | Relatively Low |
| Isabella County, MI | 22,380,001.97 | Relatively Low |
| Sanilac County, MI | 22,786,736.05 | Relatively Low |
| Manistee County, MI | 9,392,366.16 | Very Low |
| Ogemaw County, MI | 8,101,806.26 | Very Low |
| Clare County, MI | 9,492,055.62 | Relatively Low |
| Crawford County, MI | 5,309,908.66 | Very Low |
| Montmorency County, MI | 4,080,238.98 | Very Low |
| Gladwin County, MI | 9,245,254.23 | Very Low |
| Oscoda County, MI | 4,021,019.92 | Very Low |
| Clinton County, MI | 24,366,126.72 | Relatively Low |
| Branch County, MI | 13,712,801.21 | Relatively Low |
| Gratiot County, MI | 16,650,316.44 | Relatively Low |
| Ionia County, MI | 19,525,984.52 | Relatively Low |
| Kalamazoo County, MI | 55,094,169.29 | Relatively Moderate |
| Lake County, MI | 5,003,503.82 | Very Low |
| Mason County, MI | 6,539,043.78 | Very Low |
| Mecosta County, MI | 23,740,423.84 | Relatively Low |
| Muskegon County, MI | 27,692,323.50 | Relatively Low |
| Otsego County, MI | 7,626,260.80 | Very Low |
| Roscommon County, MI | 13,380,190.88 | Relatively Low |
| Washtenaw County, MI | 92,708,568.63 | Relatively Moderate |
| Barry County, MI | 17,090,616.32 | Relatively Low |
| Menominee County, MI | 11,209,409.97 | Relatively Low |
| Midland County, MI | 32,235,312.95 | Relatively Low |
| Luce County, MI | 1,715,661.39 | Very Low |
| Antrim County, MI | 9,643,059.54 | Very Low |
| Jackson County, MI | 37,815,850.91 | Relatively Low |
| St. Joseph County, MI | 18,922,448.23 | Relatively Low |
| Osceola County, MI | 6,365,674.23 | Very Low |
| Saginaw County, MI | 71,869,466.26 | Relatively Moderate |
| Hillsdale County, MI | 13,524,094.36 | Relatively Low |
| Arenac County, MI | 5,903,313.86 | Very Low |
| Kalkaska County, MI | 6,488,733.86 | Very Low |
| Bay County, MI | 38,260,074.16 | Relatively Low |
| Alpena County, MI | 7,048,536.14 | Very Low |
| Gogebic County, MI | 5,671,900.34 | Very Low |
| Dickinson County, MI | 20,926,145.77 | Relatively Low |
| Missaukee County, MI | 5,266,831.64 | Very Low |
| Montcalm County, MI | 19,262,391.00 | Relatively Low |
| Baraga County, MI | 3,783,058.24 | Very Low |
| Oceana County, MI | 10,001,404.97 | Very Low |
| Alger County, MI | 3,643,869.92 | Very Low |
| Houghton County, MI | 10,041,034.80 | Very Low |
| Ingham County, MI | 72,307,539.22 | Relatively Moderate |
| Iron County, MI | 13,138,280.46 | Relatively Low |
| Ottawa County, MI | 68,244,321.01 | Relatively Moderate |
| Grand Traverse County, MI | 31,157,394.46 | Relatively Low |
| Livingston County, MI | 55,455,315.86 | Relatively Low |
| St. Clair County, MI | 49,350,055.76 | Relatively Moderate |
| Wayne County, MI | 401,532,839.77 | Relatively High |
| Cass County, MI | 13,668,205.15 | Relatively Low |
| Kent County, MI | 147,051,297.33 | Relatively Moderate |
| Charlevoix County, MI | 8,107,083.65 | Very Low |
| Lenawee County, MI | 30,384,354.99 | Relatively Low |
| Chippewa County, MI | 7,839,344.01 | Very Low |
| Mackinac County, MI | 3,293,529.54 | Very Low |
| Schoolcraft County, MI | 3,354,239.19 | Very Low |
| Benzie County, MI | 7,374,080.96 | Very Low |
| Emmet County, MI | 12,768,087.62 | Very Low |
| Monroe County, MI | 54,722,007.37 | Relatively Moderate |
| Shiawassee County, MI | 22,064,283.70 | Relatively Low |
| Tuscola County, MI | 27,643,001.17 | Relatively Low |
| Huron County, MI | 18,258,170.13 | Relatively Low |
| Alcona County, MI | 4,734,437.97 | Very Low |
| Marquette County, MI | 26,015,591.65 | Relatively Low |
| Iosco County, MI | 8,310,265.03 | Very Low |
| Ontonagon County, MI | 2,385,606.67 | Very Low |
| Macomb County, MI | 267,979,773.84 | Relatively High |
| Genesee County, MI | 113,073,603.95 | Relatively Moderate |
| Van Buren County, MI | 20,429,404.60 | Relatively Low |
| Presque Isle County, MI | 5,387,212.87 | Very Low |
| Cheboygan County, MI | 15,259,675.07 | Relatively Low |
| Delta County, MI | 14,701,455.70 | Relatively Low |
| Berrien County, MI | 45,063,828.13 | Relatively Moderate |
| Allegan County, MI | 32,044,993.03 | Relatively Low |
| Leelanau County, MI | 15,550,078.41 | Relatively Low |
| Keweenaw County, MI | 609,298.35 | Very Low |
| Oakland County, MI | 359,060,679.21 | Relatively High |
| Eaton County, MI | 30,022,736.25 | Relatively Low |
| Calhoun County, MI | 34,536,191.88 | Relatively Low |
| Wexford County, MI | 9,355,543.21 | Very Low |
Reading the Michigan county map
The map groups 83 county estimates into five within-state loss classes. Each boundary follows the county geography, while the fill represents modeled dollars per year. The class breaks are calculated from Michigan county values, so a matching shade on another state page need not represent the same amount. Grey marks unmatched geography or an unavailable estimate. Outlined counties link to the detailed profiles available in this release; counties without profiles still contribute to the state totals.
Together, the three largest estimates account for 36.1% of Michigan modeled annual loss. Their combined population represents 39.2% of the state source population. Comparing these two shares helps distinguish the concentration of modeled dollars from the concentration of residents. Neither share identifies the exposure of an individual address, and the map does not show the location of damage within a county.
Ten largest county loss estimates
Wayne County, MI has the largest modeled expected annual loss in this comparison, about $401.5 million.
View chart data
| Place | USD / year |
|---|---|
| Wayne County, MI | 401,532,839.77 |
| Oakland County, MI | 359,060,679.21 |
| Macomb County, MI | 267,979,773.84 |
| Kent County, MI | 147,051,297.33 |
| Genesee County, MI | 113,073,603.95 |
| Washtenaw County, MI | 92,708,568.63 |
| Ingham County, MI | 72,307,539.22 |
| Saginaw County, MI | 71,869,466.26 |
| Ottawa County, MI | 68,244,321.01 |
| Livingston County, MI | 55,455,315.86 |
County totals beside population
Wayne County, MI combines about $401.5 million in modeled annual loss with 1,792,549 recorded residents. Dividing those figures gives about $224 per resident, compared with $283 statewide. On this population-adjusted measure, the county places #79 among the 83 state county records. This ratio spreads all modeled losses across residents for comparison; it is not a household bill, an insurance premium or an estimate of personal damage.
Oakland County, MI combines about $359.1 million in modeled annual loss with 1,274,114 recorded residents. Dividing those figures gives about $282 per resident, compared with $283 statewide. On this population-adjusted measure, the county places #61 among the 83 state county records. This ratio spreads all modeled losses across residents for comparison; it is not a household bill, an insurance premium or an estimate of personal damage.
State hazard loss mix
Riverine Flood leads the modeled expected annual loss mix; bar lengths share a zero baseline.
View chart data
| Hazard | USD / year | Share |
|---|---|---|
| Riverine Flood | 1,517,600,101.07 | 53.2% |
| Tornado | 473,612,503.61 | 16.6% |
| Cold Wave | 447,992,529.30 | 15.7% |
| Strong Wind | 163,647,480.89 | 5.7% |
| Heat Wave | 80,689,854.74 | 2.8% |
| Hail | 58,361,457.96 | 2.0% |
| Other | 109,112,127.44 | 3.8% |
Macomb County, MI combines about $268.0 million in modeled annual loss with 880,347 recorded residents. Dividing those figures gives about $304 per resident, compared with $283 statewide. On this population-adjusted measure, the county places #53 among the 83 state county records. This ratio spreads all modeled losses across residents for comparison; it is not a household bill, an insurance premium or an estimate of personal damage.
Where the leading hazards are concentrated
For riverine flooding, Wayne County, MI contributes 15.6% of the state hazard total. The next county, Oakland County, MI, contributes about $164.9 million annually, compared with $237.3 million for the leader. Across Michigan, 83 county records have a positive modeled estimate for this hazard. The remaining counties together account for about $1.12 billion after those two leading estimates. The state places #13 of 56 state-level entries for this hazard. Its share of the state loss mix is 53.2%. These comparisons describe modeled losses rather than future events.
County hazard rating counts
- Very Low
- Relatively Low
- Relatively Moderate
- Relatively High
- Very High
- No rating
Michigan has 83 county records in each row. Each bar shows the FEMA risk rating distribution for one of the three largest modeled-loss hazards.
View chart data
| Hazard | Rating | Count |
|---|---|---|
| Riverine Flood | Very Low | 14 |
| Riverine Flood | Relatively Low | 47 |
| Riverine Flood | Relatively Moderate | 18 |
| Riverine Flood | Relatively High | 3 |
| Riverine Flood | Very High | 1 |
| Riverine Flood | No rating | 0 |
| Tornado | Very Low | 27 |
| Tornado | Relatively Low | 22 |
| Tornado | Relatively Moderate | 23 |
| Tornado | Relatively High | 8 |
| Tornado | Very High | 3 |
| Tornado | No rating | 0 |
| Cold Wave | Very Low | 2 |
| Cold Wave | Relatively Low | 32 |
| Cold Wave | Relatively Moderate | 33 |
| Cold Wave | Relatively High | 13 |
| Cold Wave | Very High | 3 |
| Cold Wave | No rating | 0 |
For tornadoes, Oakland County, MI contributes 21.5% of the state hazard total. The next county, Macomb County, MI, contributes about $58.5 million annually, compared with $102.1 million for the leader. Across Michigan, 83 county records have a positive modeled estimate for this hazard. The remaining counties together account for about $313.1 million after those two leading estimates. The state places #4 of 56 state-level entries for this hazard. Its share of the state loss mix is 16.6%. These comparisons describe modeled losses rather than future events.
For cold waves, Wayne County, MI contributes 13.3% of the state hazard total. The next county, Oakland County, MI, contributes about $55.4 million annually, compared with $59.8 million for the leader. Across Michigan, 83 county records have a positive modeled estimate for this hazard. The remaining counties together account for about $332.8 million after those two leading estimates. The state places #5 of 56 state-level entries for this hazard. Its share of the state loss mix is 15.7%. These comparisons describe modeled losses rather than future events.
For strong wind, Wayne County, MI contributes 7.8% of the state hazard total. The next county, Mecosta County, MI, contributes about $11.3 million annually, compared with $12.7 million for the leader. Across Michigan, 83 county records have a positive modeled estimate for this hazard. The remaining counties together account for about $139.6 million after those two leading estimates. The state places #3 of 56 state-level entries for this hazard. Its share of the state loss mix is 5.7%. These comparisons describe modeled losses rather than future events.
For heat waves, Wayne County, MI contributes 39.4% of the state hazard total. The next county, Oakland County, MI, contributes about $13.4 million annually, compared with $31.8 million for the leader. Across Michigan, 83 county records have a positive modeled estimate for this hazard. The remaining counties together account for about $35.5 million after those two leading estimates. The state places #26 of 56 state-level entries for this hazard. Its share of the state loss mix is 2.8%. These comparisons describe modeled losses rather than future events.
For hail, Kalamazoo County, MI contributes 10.0% of the state hazard total. The next county, Marquette County, MI, contributes about $3.3 million annually, compared with $5.8 million for the leader. Across Michigan, 83 county records have a positive modeled estimate for this hazard. The remaining counties together account for about $49.2 million after those two leading estimates. The state places #15 of 56 state-level entries for this hazard. Its share of the state loss mix is 2.0%. These comparisons describe modeled losses rather than future events.
Michigan hazard totals and county comparisons
| Hazard | Modeled annual loss | State share | VH / RH counties | Largest county | US state rank |
|---|---|---|---|---|---|
| Riverine Flood | $1.52 billion | 53.2% | 1 / 3 | Wayne County, MI | #13 of 56 |
| Tornado | $473.6 million | 16.6% | 3 / 8 | Oakland County, MI | #4 of 56 |
| Cold Wave | $448.0 million | 15.7% | 3 / 13 | Wayne County, MI | #5 of 56 |
| Strong Wind | $163.6 million | 5.7% | 6 / 30 | Wayne County, MI | #3 of 56 |
| Heat Wave | $80.7 million | 2.8% | 0 / 2 | Wayne County, MI | #26 of 56 |
| Hail | $58.4 million | 2.0% | 0 / 3 | Kalamazoo County, MI | #15 of 56 |
| Earthquake | $32.1 million | 1.1% | 0 / 0 | Wayne County, MI | #36 of 56 |
| Lightning | $29.0 million | 1.0% | 1 / 7 | Wayne County, MI | #23 of 56 |
| Ice Storm | $23.8 million | 0.8% | 3 / 7 | Oakland County, MI | #13 of 56 |
| Winter Weather | $18.8 million | 0.7% | 2 / 26 | Grand Traverse County, MI | #10 of 56 |
| Wildfire | $2.3 million | 0.1% | 0 / 0 | Chippewa County, MI | #37 of 56 |
| Hurricane | $1.7 million | 0.1% | 0 / 0 | Huron County, MI | #33 of 56 |
| Drought | $668,000 | 0.0% | 0 / 0 | St. Joseph County, MI | #43 of 56 |
| Coastal Flood | $561,000 | 0.0% | 0 / 0 | Wayne County, MI | #26 of 56 |
| Landslide | $263,000 | 0.0% | 0 / 0 | Kent County, MI | #35 of 56 |
Hazard shares show which modeled expected annual losses dominate the state total; ranks compare state totals for the same hazard.
Michigan hazard totals combine the county estimates. The largest county column identifies concentration within each hazard; the state rank compares the same hazard across state-level entries.
Michigan county loss totals
| County | Risk index rating | Modeled annual loss | Largest hazard |
|---|---|---|---|
| Wayne County | Relatively High | $401.5 million | Riverine Flood |
| Oakland County | Relatively High | $359.1 million | Riverine Flood |
| Macomb County | Relatively High | $268.0 million | Riverine Flood |
| Kent County | Relatively Moderate | $147.1 million | Riverine Flood |
| Genesee County | Relatively Moderate | $113.1 million | Riverine Flood |
| Washtenaw County | Relatively Moderate | $92.7 million | Riverine Flood |
| Ingham County | Relatively Moderate | $72.3 million | Riverine Flood |
| Saginaw County | Relatively Moderate | $71.9 million | Riverine Flood |
| Ottawa County | Relatively Moderate | $68.2 million | Riverine Flood |
| Livingston County | Relatively Low | $55.5 million | Riverine Flood |
| Kalamazoo County | Relatively Moderate | $55.1 million | Riverine Flood |
| Monroe County | Relatively Moderate | $54.7 million | Riverine Flood |
| St. Clair County | Relatively Moderate | $49.4 million | Riverine Flood |
| Berrien County | Relatively Moderate | $45.1 million | Riverine Flood |
| Bay County | Relatively Low | $38.3 million | Riverine Flood |
Show all 83 counties
| County | Risk index rating | Modeled annual loss | Largest hazard |
|---|---|---|---|
| Jackson County | Relatively Low | $37.8 million | Riverine Flood |
| Calhoun County | Relatively Low | $34.5 million | Riverine Flood |
| Midland County | Relatively Low | $32.2 million | Riverine Flood |
| Allegan County | Relatively Low | $32.0 million | Riverine Flood |
| Grand Traverse County | Relatively Low | $31.2 million | Cold Wave |
| Lenawee County | Relatively Low | $30.4 million | Riverine Flood |
| Eaton County | Relatively Low | $30.0 million | Riverine Flood |
| Lapeer County | Relatively Low | $28.0 million | Riverine Flood |
| Muskegon County | Relatively Low | $27.7 million | Riverine Flood |
| Tuscola County | Relatively Low | $27.6 million | Riverine Flood |
| Marquette County | Relatively Low | $26.0 million | Cold Wave |
| Clinton County | Relatively Low | $24.4 million | Riverine Flood |
| Mecosta County | Relatively Low | $23.7 million | Strong Wind |
| Sanilac County | Relatively Low | $22.8 million | Cold Wave |
| Isabella County | Relatively Low | $22.4 million | Riverine Flood |
| Shiawassee County | Relatively Low | $22.1 million | Riverine Flood |
| Dickinson County | Relatively Low | $20.9 million | Cold Wave |
| Van Buren County | Relatively Low | $20.4 million | Riverine Flood |
| Ionia County | Relatively Low | $19.5 million | Riverine Flood |
| Montcalm County | Relatively Low | $19.3 million | Riverine Flood |
| St. Joseph County | Relatively Low | $18.9 million | Riverine Flood |
| Huron County | Relatively Low | $18.3 million | Riverine Flood |
| Barry County | Relatively Low | $17.1 million | Riverine Flood |
| Gratiot County | Relatively Low | $16.7 million | Riverine Flood |
| Leelanau County | Relatively Low | $15.6 million | Cold Wave |
| Cheboygan County | Relatively Low | $15.3 million | Riverine Flood |
| Delta County | Relatively Low | $14.7 million | Riverine Flood |
| Branch County | Relatively Low | $13.7 million | Riverine Flood |
| Cass County | Relatively Low | $13.7 million | Riverine Flood |
| Hillsdale County | Relatively Low | $13.5 million | Riverine Flood |
| Roscommon County | Relatively Low | $13.4 million | Riverine Flood |
| Newaygo County | Relatively Low | $13.2 million | Riverine Flood |
| Iron County | Relatively Low | $13.1 million | Cold Wave |
| Emmet County | Very Low | $12.8 million | Riverine Flood |
| Menominee County | Relatively Low | $11.2 million | Cold Wave |
| Houghton County | Very Low | $10.0 million | Riverine Flood |
| Oceana County | Very Low | $10.0 million | Riverine Flood |
| Antrim County | Very Low | $9.6 million | Riverine Flood |
| Clare County | Relatively Low | $9.5 million | Riverine Flood |
| Manistee County | Very Low | $9.4 million | Riverine Flood |
| Wexford County | Very Low | $9.4 million | Riverine Flood |
| Gladwin County | Very Low | $9.2 million | Riverine Flood |
| Iosco County | Very Low | $8.3 million | Riverine Flood |
| Charlevoix County | Very Low | $8.1 million | Riverine Flood |
| Ogemaw County | Very Low | $8.1 million | Riverine Flood |
| Chippewa County | Very Low | $7.8 million | Riverine Flood |
| Otsego County | Very Low | $7.6 million | Riverine Flood |
| Benzie County | Very Low | $7.4 million | Riverine Flood |
| Alpena County | Very Low | $7.0 million | Riverine Flood |
| Mason County | Very Low | $6.5 million | Riverine Flood |
| Kalkaska County | Very Low | $6.5 million | Riverine Flood |
| Osceola County | Very Low | $6.4 million | Riverine Flood |
| Arenac County | Very Low | $5.9 million | Riverine Flood |
| Gogebic County | Very Low | $5.7 million | Riverine Flood |
| Presque Isle County | Very Low | $5.4 million | Riverine Flood |
| Crawford County | Very Low | $5.3 million | Riverine Flood |
| Missaukee County | Very Low | $5.3 million | Riverine Flood |
| Lake County | Very Low | $5.0 million | Riverine Flood |
| Alcona County | Very Low | $4.7 million | Riverine Flood |
| Montmorency County | Very Low | $4.1 million | Riverine Flood |
| Oscoda County | Very Low | $4.0 million | Riverine Flood |
| Baraga County | Very Low | $3.8 million | Cold Wave |
| Alger County | Very Low | $3.6 million | Riverine Flood |
| Schoolcraft County | Very Low | $3.4 million | Riverine Flood |
| Mackinac County | Very Low | $3.3 million | Riverine Flood |
| Ontonagon County | Very Low | $2.4 million | Riverine Flood |
| Luce County | Very Low | $1.7 million | Riverine Flood |
| Keweenaw County | Very Low | $609,000 | Riverine Flood |
Michigan population, values and ratings
- Population
- 10,071,992
- Building value
- $2,305.66 billion
- Agricultural value
- $10.58 billion
- Modeled loss per resident
- $283
Overall county risk ratings
- Very Low: 33
- Relatively Low: 37
- Relatively Moderate: 10
- Relatively High: 3
Michigan overall ratings describe relative county risk. Segment widths count counties, rather than residents or modeled dollars.
View chart data
| Rating | Count |
|---|---|
| Very Low | 33 |
| Relatively Low | 37 |
| Relatively Moderate | 10 |
| Relatively High | 3 |
Michigan county pages
Michigan has 1 detailed county page linked below.
Questions about Michigan
Which Michigan county has the largest modeled loss?
Wayne County, MI leads Michigan, with about $401.5 million in modeled expected annual loss.
Which hazard leads modeled loss in Michigan?
Riverine flooding leads Michigan, at about $1.52 billion annually.
What total loss does FEMA model for Michigan?
Michigan has about $2.85 billion in modeled expected annual loss.
What share of national loss belongs to Michigan?
The state accounts for 1.9% of national modeled loss.
How many counties appear in the Michigan table?
The Michigan table contains 83 counties and county equivalents.
Where does Michigan rank by modeled loss?
Michigan places #18 of 56 state-level entries by modeled expected annual loss.
Does the Michigan estimate predict next year?
The Michigan figure is a long-run modeled annual average, rather than a forecast for any single year.
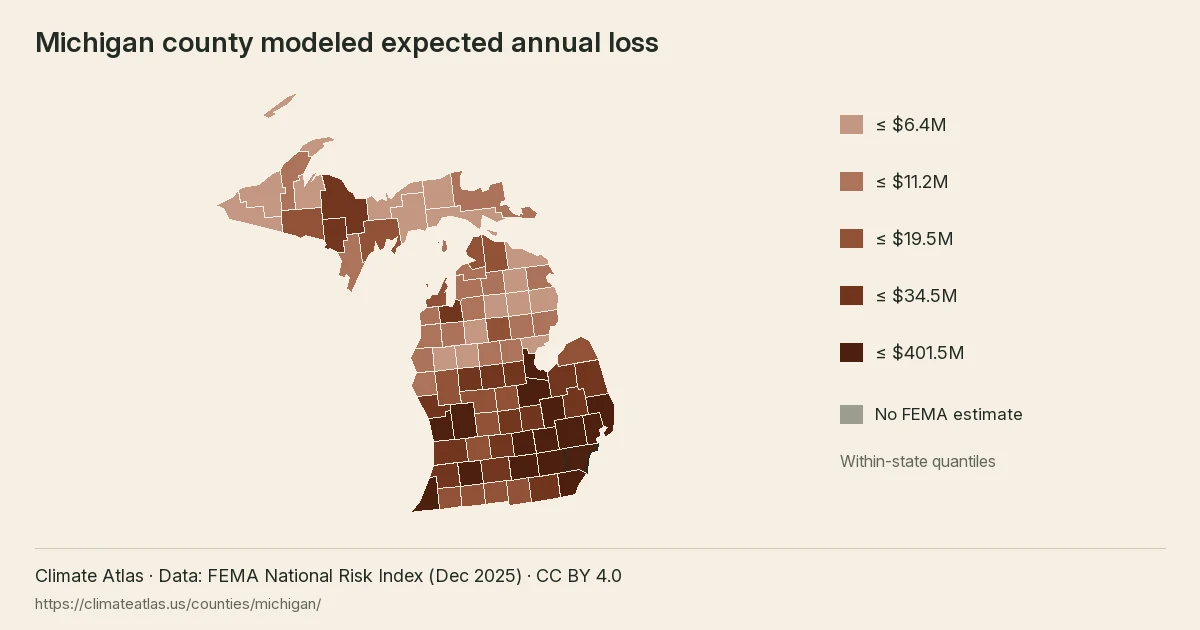
Michigan county modeled expected annual loss, in five within-state quantile classes.