Texas natural hazard risk by county
Texas has about $12.35 billion in modeled expected annual loss across 254 counties. The state accounts for 8.0% of the national modeled loss total. Its total ranks #2 among 56 state-level entries by modeled loss. FEMA published these 254 county estimates in its December 2025 National Risk Index. The modeled $12.35 billion annual average does not predict loss in any one year.
- Modeled expected annual loss
- $12.35 billion / year
- Share of US loss
- 8.0%
- State loss rank
- #2 of 56
- Largest modeled-loss hazard
- Riverine Flood
Texas county modeled loss
- Positive estimates to $4.6 million
- Above $4.6 million to $8.9 million
- Above $8.9 million to $16.2 million
- Above $16.2 million to $33.9 million
- Above $33.9 million to $2.22 billion
- No FEMA estimate
Texas counties use five within-state quantile classes of modeled expected annual loss. Darker rust means a larger estimate; outlined counties have detailed pages.
View chart data
| County | Modeled expected annual loss (USD/year) | Overall risk rating |
|---|---|---|
| Walker County, TX | 25,045,322.05 | Relatively Low |
| Brooks County, TX | 13,480,520.13 | Relatively Low |
| Deaf Smith County, TX | 19,822,855.37 | Relatively Low |
| Hockley County, TX | 13,765,278.27 | Relatively Low |
| Shackelford County, TX | 2,352,019.49 | Very Low |
| Tom Green County, TX | 30,903,796.24 | Relatively Low |
| Wise County, TX | 20,319,228.65 | Relatively Low |
| Cottle County, TX | 3,160,814.78 | Very Low |
| Taylor County, TX | 53,651,454.36 | Relatively Moderate |
| Armstrong County, TX | 6,366,236.51 | Very Low |
| Hutchinson County, TX | 22,328,483.86 | Relatively Low |
| Irion County, TX | 1,344,756.85 | Very Low |
| Mitchell County, TX | 5,759,176.90 | Very Low |
| Yoakum County, TX | 8,474,017.80 | Relatively Low |
| Childress County, TX | 6,350,539.04 | Very Low |
| Gillespie County, TX | 17,008,908.74 | Relatively Low |
| Dickens County, TX | 3,460,258.46 | Very Low |
| La Salle County, TX | 4,310,193.42 | Very Low |
| Hansford County, TX | 11,951,559.70 | Very Low |
| Potter County, TX | 63,442,825.28 | Relatively Moderate |
| Falls County, TX | 5,967,030.32 | Very Low |
| Hamilton County, TX | 4,900,545.23 | Very Low |
| Runnels County, TX | 6,966,378.30 | Very Low |
| Hale County, TX | 30,890,332.23 | Relatively Low |
| San Jacinto County, TX | 14,149,034.95 | Relatively Low |
| Duval County, TX | 9,930,506.23 | Relatively Low |
| Moore County, TX | 20,327,159.39 | Relatively Low |
| Martin County, TX | 5,496,957.09 | Very Low |
| Limestone County, TX | 13,088,090.89 | Relatively Low |
| Zavala County, TX | 9,793,490.54 | Relatively Low |
| Cochran County, TX | 3,977,248.13 | Very Low |
| Fisher County, TX | 2,904,838.98 | Very Low |
| Baylor County, TX | 4,225,490.60 | Very Low |
| Panola County, TX | 12,893,869.18 | Relatively Low |
| Jack County, TX | 5,452,344.75 | Very Low |
| Coryell County, TX | 22,910,564.83 | Relatively Low |
| Lipscomb County, TX | 8,683,893.52 | Very Low |
| Donley County, TX | 6,640,308.97 | Very Low |
| Atascosa County, TX | 13,881,347.38 | Relatively Low |
| Briscoe County, TX | 5,882,475.57 | Very Low |
| Goliad County, TX | 6,307,484.77 | Very Low |
| Gray County, TX | 18,410,852.36 | Relatively Low |
| Hall County, TX | 6,675,895.66 | Very Low |
| Brown County, TX | 19,260,051.46 | Relatively Low |
| Gaines County, TX | 12,924,365.24 | Relatively Low |
| Bell County, TX | 107,015,747.83 | Relatively Moderate |
| Sutton County, TX | 2,522,161.13 | Very Low |
| San Augustine County, TX | 3,861,935.95 | Very Low |
| King County, TX | 401,172.99 | Very Low |
| Uvalde County, TX | 20,393,723.62 | Relatively Low |
| Wilson County, TX | 31,923,288.48 | Relatively Low |
| Schleicher County, TX | 2,252,984.96 | Very Low |
| Swisher County, TX | 9,053,263.28 | Very Low |
| Motley County, TX | 1,807,477.45 | Very Low |
| Lynn County, TX | 6,144,741.16 | Very Low |
| Menard County, TX | 1,961,054.64 | Very Low |
| Nolan County, TX | 7,323,663.13 | Very Low |
| Sterling County, TX | 1,516,283.66 | Very Low |
| Garza County, TX | 4,703,414.79 | Very Low |
| Callahan County, TX | 4,780,607.78 | Very Low |
| Stonewall County, TX | 1,999,960.93 | Very Low |
| Franklin County, TX | 6,799,121.29 | Very Low |
| Van Zandt County, TX | 20,051,939.56 | Relatively Low |
| Hunt County, TX | 43,280,681.03 | Relatively Moderate |
| Madison County, TX | 9,242,656.36 | Very Low |
| Hood County, TX | 29,111,764.22 | Relatively Low |
| Mason County, TX | 3,315,765.22 | Very Low |
| Gregg County, TX | 54,636,466.90 | Relatively Moderate |
| Hemphill County, TX | 6,161,520.02 | Very Low |
| Castro County, TX | 7,725,428.89 | Very Low |
| Upton County, TX | 3,138,476.90 | Very Low |
| Jim Hogg County, TX | 7,839,284.97 | Relatively Low |
| Lavaca County, TX | 33,821,141.87 | Relatively Low |
| Midland County, TX | 48,680,809.68 | Relatively Moderate |
| Kimble County, TX | 6,301,554.11 | Very Low |
| Carson County, TX | 11,480,554.75 | Very Low |
| Palo Pinto County, TX | 14,707,950.19 | Relatively Low |
| Lamb County, TX | 14,970,862.59 | Relatively Low |
| Eastland County, TX | 9,466,613.55 | Very Low |
| Kerr County, TX | 25,303,375.22 | Relatively Low |
| Lubbock County, TX | 213,541,890.92 | Relatively High |
| Erath County, TX | 33,944,284.98 | Relatively Low |
| Upshur County, TX | 21,426,008.18 | Relatively Low |
| Blanco County, TX | 10,118,727.04 | Very Low |
| Andrews County, TX | 5,992,372.68 | Very Low |
| Jeff Davis County, TX | 1,920,950.47 | Very Low |
| Knox County, TX | 4,097,870.85 | Very Low |
| Llano County, TX | 18,551,109.27 | Relatively Low |
| Wheeler County, TX | 8,990,989.02 | Very Low |
| Crosby County, TX | 4,576,494.38 | Very Low |
| McMullen County, TX | 875,329.03 | Very Low |
| Roberts County, TX | 3,429,746.86 | Very Low |
| Kent County, TX | 1,357,530.69 | Very Low |
| Comal County, TX | 143,721,897.42 | Relatively Moderate |
| Zapata County, TX | 5,508,214.57 | Very Low |
| Aransas County, TX | 15,231,956.80 | Relatively Low |
| Orange County, TX | 54,308,170.02 | Relatively Moderate |
| Winkler County, TX | 2,382,731.36 | Very Low |
| Jones County, TX | 8,858,674.35 | Very Low |
| Sherman County, TX | 10,676,254.24 | Very Low |
| Chambers County, TX | 30,430,400.82 | Relatively Low |
| Hardin County, TX | 27,120,808.17 | Relatively Low |
| Hill County, TX | 24,715,072.77 | Relatively Low |
| Williamson County, TX | 136,605,414.09 | Relatively Moderate |
| Kinney County, TX | 1,297,420.30 | Very Low |
| Calhoun County, TX | 21,605,814.91 | Relatively Low |
| Ellis County, TX | 46,926,908.16 | Relatively Moderate |
| Clay County, TX | 5,678,255.59 | Very Low |
| Kaufman County, TX | 42,721,062.29 | Relatively Low |
| Foard County, TX | 2,303,771.15 | Very Low |
| Collin County, TX | 716,302,548.69 | Relatively High |
| Comanche County, TX | 11,000,929.46 | Relatively Low |
| Concho County, TX | 2,389,147.34 | Very Low |
| Crane County, TX | 970,999.76 | Very Low |
| Jasper County, TX | 15,456,067.86 | Relatively Low |
| Gonzales County, TX | 36,827,645.07 | Relatively Moderate |
| Jefferson County, TX | 140,693,600.50 | Relatively High |
| Dimmit County, TX | 6,265,750.80 | Very Low |
| Bowie County, TX | 33,387,956.49 | Relatively Low |
| Brewster County, TX | 6,728,540.41 | Very Low |
| Dallam County, TX | 14,231,306.65 | Relatively Low |
| Cass County, TX | 10,776,656.02 | Relatively Low |
| Fayette County, TX | 17,087,026.74 | Relatively Low |
| Burnet County, TX | 25,824,364.11 | Relatively Low |
| Refugio County, TX | 7,870,605.18 | Very Low |
| Ochiltree County, TX | 14,506,795.01 | Very Low |
| Matagorda County, TX | 33,307,199.00 | Relatively Low |
| Throckmorton County, TX | 2,283,760.91 | Very Low |
| Anderson County, TX | 23,248,067.77 | Relatively Low |
| Caldwell County, TX | 33,047,178.33 | Relatively Low |
| Medina County, TX | 20,514,960.04 | Relatively Low |
| Glasscock County, TX | 2,613,791.90 | Very Low |
| Kenedy County, TX | 6,830,703.74 | Very Low |
| Wood County, TX | 15,178,294.50 | Relatively Low |
| Liberty County, TX | 32,533,654.05 | Relatively Low |
| Travis County, TX | 376,349,275.40 | Relatively High |
| Montgomery County, TX | 221,873,100.10 | Relatively High |
| Howard County, TX | 13,769,115.84 | Relatively Low |
| Bastrop County, TX | 42,516,436.35 | Relatively Moderate |
| Trinity County, TX | 12,933,669.84 | Relatively Low |
| McLennan County, TX | 84,482,866.14 | Relatively Moderate |
| McCulloch County, TX | 3,668,905.95 | Very Low |
| Brazoria County, TX | 161,466,357.99 | Relatively Moderate |
| Bailey County, TX | 7,777,179.88 | Very Low |
| Houston County, TX | 13,135,435.54 | Relatively Low |
| San Saba County, TX | 3,303,199.91 | Very Low |
| Presidio County, TX | 2,561,905.33 | Very Low |
| Nacogdoches County, TX | 31,997,729.09 | Relatively Low |
| Washington County, TX | 21,335,244.65 | Relatively Low |
| Cooke County, TX | 28,478,847.31 | Relatively Low |
| Wilbarger County, TX | 10,580,613.85 | Relatively Low |
| Leon County, TX | 15,103,466.86 | Relatively Low |
| Karnes County, TX | 11,998,769.34 | Relatively Low |
| Randall County, TX | 70,389,316.24 | Relatively Moderate |
| DeWitt County, TX | 31,384,919.74 | Relatively Moderate |
| Ward County, TX | 4,149,288.05 | Very Low |
| Wichita County, TX | 39,704,522.81 | Relatively Moderate |
| Willacy County, TX | 21,369,100.55 | Relatively Low |
| Shelby County, TX | 12,945,398.24 | Relatively Low |
| Kendall County, TX | 26,113,387.05 | Relatively Low |
| Morris County, TX | 7,015,209.53 | Very Low |
| Hopkins County, TX | 27,942,329.65 | Relatively Low |
| Rockwall County, TX | 46,394,455.40 | Relatively Low |
| Hudspeth County, TX | 1,666,824.19 | Very Low |
| Smith County, TX | 43,128,730.25 | Relatively Moderate |
| Hidalgo County, TX | 309,750,572.10 | Relatively High |
| Brazos County, TX | 62,684,279.57 | Relatively Moderate |
| Burleson County, TX | 7,476,654.84 | Very Low |
| Delta County, TX | 4,073,111.13 | Very Low |
| Crockett County, TX | 3,355,877.08 | Very Low |
| Lee County, TX | 11,709,676.68 | Very Low |
| Robertson County, TX | 7,196,351.93 | Very Low |
| Mills County, TX | 2,230,939.48 | Very Low |
| Loving County, TX | 58,036.69 | Very Low |
| Sabine County, TX | 5,651,633.42 | Very Low |
| Austin County, TX | 14,472,469.56 | Relatively Low |
| Reagan County, TX | 2,980,773.95 | Very Low |
| Reeves County, TX | 5,468,976.99 | Very Low |
| Tarrant County, TX | 608,073,828.10 | Relatively High |
| Hays County, TX | 108,590,843.40 | Relatively Moderate |
| San Patricio County, TX | 39,490,067.63 | Relatively Moderate |
| Oldham County, TX | 4,239,957.81 | Very Low |
| Pecos County, TX | 5,737,045.12 | Very Low |
| Real County, TX | 7,676,390.09 | Very Low |
| Dallas County, TX | 973,176,568.66 | Very High |
| Nueces County, TX | 186,057,980.49 | Relatively High |
| Red River County, TX | 15,633,998.91 | Relatively Low |
| Coleman County, TX | 4,991,260.73 | Very Low |
| Rusk County, TX | 14,932,764.60 | Relatively Low |
| Terrell County, TX | 544,922.02 | Very Low |
| Tyler County, TX | 14,086,858.67 | Relatively Low |
| Victoria County, TX | 53,376,857.05 | Relatively Moderate |
| Webb County, TX | 46,479,956.27 | Relatively Moderate |
| Wharton County, TX | 35,020,951.37 | Relatively Moderate |
| Kleberg County, TX | 35,337,760.38 | Relatively Moderate |
| Harris County, TX | 2,217,702,382.78 | Very High |
| Hardeman County, TX | 2,539,374.60 | Very Low |
| Newton County, TX | 5,498,961.66 | Very Low |
| Navarro County, TX | 26,540,046.10 | Relatively Low |
| Montague County, TX | 15,595,286.75 | Relatively Low |
| Frio County, TX | 10,652,522.91 | Relatively Low |
| Harrison County, TX | 28,738,265.61 | Relatively Low |
| Lamar County, TX | 31,926,282.75 | Relatively Low |
| Floyd County, TX | 7,754,978.29 | Very Low |
| Starr County, TX | 29,524,012.99 | Relatively Moderate |
| Stephens County, TX | 4,592,094.05 | Very Low |
| Parmer County, TX | 47,945,371.50 | Relatively Moderate |
| Marion County, TX | 5,598,656.81 | Very Low |
| Val Verde County, TX | 23,550,897.66 | Relatively Low |
| El Paso County, TX | 120,821,270.21 | Relatively High |
| Coke County, TX | 2,275,153.54 | Very Low |
| Cameron County, TX | 165,130,655.83 | Relatively High |
| Waller County, TX | 23,903,500.75 | Relatively Low |
| Bee County, TX | 16,196,021.22 | Relatively Low |
| Titus County, TX | 11,846,189.74 | Relatively Low |
| Camp County, TX | 7,402,370.21 | Very Low |
| Grimes County, TX | 14,408,115.57 | Relatively Low |
| Scurry County, TX | 8,291,038.72 | Very Low |
| Jim Wells County, TX | 38,236,119.75 | Relatively Moderate |
| Ector County, TX | 46,414,961.83 | Relatively Moderate |
| Rains County, TX | 5,636,080.74 | Very Low |
| Parker County, TX | 52,802,751.31 | Relatively Moderate |
| Young County, TX | 10,817,835.18 | Very Low |
| Polk County, TX | 24,454,915.67 | Relatively Low |
| Angelina County, TX | 23,363,525.06 | Relatively Low |
| Live Oak County, TX | 7,329,665.74 | Very Low |
| Dawson County, TX | 8,390,666.91 | Very Low |
| Haskell County, TX | 4,418,996.24 | Very Low |
| Terry County, TX | 12,209,707.10 | Relatively Low |
| Archer County, TX | 3,892,914.86 | Very Low |
| Henderson County, TX | 37,397,556.69 | Relatively Moderate |
| Bosque County, TX | 9,121,147.56 | Very Low |
| Hartley County, TX | 13,997,151.99 | Very Low |
| Collingsworth County, TX | 7,503,475.74 | Very Low |
| Somervell County, TX | 7,658,512.41 | Very Low |
| Colorado County, TX | 15,859,878.08 | Relatively Low |
| Freestone County, TX | 13,357,977.48 | Relatively Low |
| Borden County, TX | 2,666,804.97 | Very Low |
| Culberson County, TX | 2,826,454.58 | Very Low |
| Galveston County, TX | 197,978,889.12 | Relatively High |
| Lampasas County, TX | 7,655,678.00 | Very Low |
| Edwards County, TX | 2,049,887.58 | Very Low |
| Guadalupe County, TX | 123,697,247.17 | Relatively Moderate |
| Cherokee County, TX | 17,265,254.04 | Relatively Low |
| Fannin County, TX | 26,860,378.32 | Relatively Low |
| Fort Bend County, TX | 346,168,109.24 | Relatively High |
| Milam County, TX | 12,634,468.41 | Relatively Low |
| Bexar County, TX | 619,365,285.39 | Relatively High |
| Johnson County, TX | 70,656,023.07 | Relatively Moderate |
| Denton County, TX | 354,730,645.71 | Relatively High |
| Bandera County, TX | 17,039,978.37 | Relatively Low |
| Maverick County, TX | 13,344,980.52 | Relatively Low |
| Jackson County, TX | 23,971,438.06 | Relatively Low |
| Grayson County, TX | 42,594,160.14 | Relatively Low |
Reading the Texas county map
The map groups 254 county estimates into five within-state loss classes. Each boundary follows the county geography, while the fill represents modeled dollars per year. The class breaks are calculated from Texas county values, so a matching shade on another state page need not represent the same amount. Grey marks unmatched geography or an unavailable estimate. Outlined counties link to the detailed profiles available in this release; counties without profiles still contribute to the state totals.
Together, the three largest estimates account for 31.6% of Texas modeled annual loss. Their combined population represents 28.9% of the state source population. Comparing these two shares helps distinguish the concentration of modeled dollars from the concentration of residents. Neither share identifies the exposure of an individual address, and the map does not show the location of damage within a county.
Ten largest county loss estimates
Harris County, TX has the largest modeled expected annual loss in this comparison, about $2.22 billion.
View chart data
| Place | USD / year |
|---|---|
| Harris County, TX | 2,217,702,382.78 |
| Dallas County, TX | 973,176,568.66 |
| Collin County, TX | 716,302,548.69 |
| Bexar County, TX | 619,365,285.39 |
| Tarrant County, TX | 608,073,828.10 |
| Travis County, TX | 376,349,275.40 |
| Denton County, TX | 354,730,645.71 |
| Fort Bend County, TX | 346,168,109.24 |
| Hidalgo County, TX | 309,750,572.10 |
| Montgomery County, TX | 221,873,100.10 |
County totals beside population
Harris County, TX combines about $2.22 billion in modeled annual loss with 4,726,200 recorded residents. Dividing those figures gives about $469 per resident, compared with $424 statewide. On this population-adjusted measure, the county places #183 among the 254 state county records. This ratio spreads all modeled losses across residents for comparison; it is not a household bill, an insurance premium or an estimate of personal damage.
Dallas County, TX combines about $973.2 million in modeled annual loss with 2,607,218 recorded residents. Dividing those figures gives about $373 per resident, compared with $424 statewide. On this population-adjusted measure, the county places #214 among the 254 state county records. This ratio spreads all modeled losses across residents for comparison; it is not a household bill, an insurance premium or an estimate of personal damage.
State hazard loss mix
Riverine Flood leads the modeled expected annual loss mix; bar lengths share a zero baseline.
View chart data
| Hazard | USD / year | Share |
|---|---|---|
| Riverine Flood | 4,941,422,497.40 | 40.0% |
| Tornado | 2,368,553,543.36 | 19.2% |
| Hurricane | 1,273,624,382.65 | 10.3% |
| Cold Wave | 1,093,818,284.60 | 8.9% |
| Hail | 834,928,781.27 | 6.8% |
| Heat Wave | 797,443,118.83 | 6.5% |
| Other | 1,037,434,679.54 | 8.4% |
Collin County, TX combines about $716.3 million in modeled annual loss with 1,063,649 recorded residents. Dividing those figures gives about $673 per resident, compared with $424 statewide. On this population-adjusted measure, the county places #119 among the 254 state county records. This ratio spreads all modeled losses across residents for comparison; it is not a household bill, an insurance premium or an estimate of personal damage.
Where the leading hazards are concentrated
For riverine flooding, Harris County, TX contributes 22.7% of the state hazard total. The next county, Bexar County, TX, contributes about $364.8 million annually, compared with $1.12 billion for the leader. Across Texas, 254 county records have a positive modeled estimate for this hazard. The remaining counties together account for about $3.45 billion after those two leading estimates. The state places #2 of 56 state-level entries for this hazard. Its share of the state loss mix is 40.0%. These comparisons describe modeled losses rather than future events.
County hazard rating counts
- Very Low
- Relatively Low
- Relatively Moderate
- Relatively High
- Very High
- No rating
Texas has 254 county records in each row. Each bar shows the FEMA risk rating distribution for one of the three largest modeled-loss hazards.
View chart data
| Hazard | Rating | Count |
|---|---|---|
| Riverine Flood | Very Low | 123 |
| Riverine Flood | Relatively Low | 76 |
| Riverine Flood | Relatively Moderate | 39 |
| Riverine Flood | Relatively High | 13 |
| Riverine Flood | Very High | 3 |
| Riverine Flood | No rating | 0 |
| Tornado | Very Low | 54 |
| Tornado | Relatively Low | 85 |
| Tornado | Relatively Moderate | 68 |
| Tornado | Relatively High | 38 |
| Tornado | Very High | 9 |
| Tornado | No rating | 0 |
| Hurricane | Very Low | 136 |
| Hurricane | Relatively Low | 59 |
| Hurricane | Relatively Moderate | 29 |
| Hurricane | Relatively High | 12 |
| Hurricane | Very High | 5 |
| Hurricane | No rating | 13 |
For tornadoes, Collin County, TX contributes 17.7% of the state hazard total. The next county, Harris County, TX, contributes about $407.4 million annually, compared with $420.4 million for the leader. Across Texas, 254 county records have a positive modeled estimate for this hazard. The remaining counties together account for about $1.54 billion after those two leading estimates. The state places #1 of 56 state-level entries for this hazard. Its share of the state loss mix is 19.2%. These comparisons describe modeled losses rather than future events.
For hurricanes, Harris County, TX contributes 35.9% of the state hazard total. The next county, Hidalgo County, TX, contributes about $126.7 million annually, compared with $457.9 million for the leader. Across Texas, 241 county records have a positive modeled estimate for this hazard. The remaining counties together account for about $689.0 million after those two leading estimates. The state places #5 of 56 state-level entries for this hazard. Its share of the state loss mix is 10.3%. These comparisons describe modeled losses rather than future events.
For cold waves, Harris County, TX contributes 10.8% of the state hazard total. The next county, Dallas County, TX, contributes about $98.4 million annually, compared with $118.1 million for the leader. Across Texas, 254 county records have a positive modeled estimate for this hazard. The remaining counties together account for about $877.3 million after those two leading estimates. The state places #2 of 56 state-level entries for this hazard. Its share of the state loss mix is 8.9%. These comparisons describe modeled losses rather than future events.
For hail, Dallas County, TX contributes 15.3% of the state hazard total. The next county, Tarrant County, TX, contributes about $112.5 million annually, compared with $127.5 million for the leader. Across Texas, 254 county records have a positive modeled estimate for this hazard. The remaining counties together account for about $594.9 million after those two leading estimates. The state places #1 of 56 state-level entries for this hazard. Its share of the state loss mix is 6.8%. These comparisons describe modeled losses rather than future events.
For heat waves, Dallas County, TX contributes 36.2% of the state hazard total. The next county, Harris County, TX, contributes about $80.4 million annually, compared with $288.4 million for the leader. Across Texas, 254 county records have a positive modeled estimate for this hazard. The remaining counties together account for about $428.7 million after those two leading estimates. The state places #2 of 56 state-level entries for this hazard. Its share of the state loss mix is 6.5%. These comparisons describe modeled losses rather than future events.
Texas hazard totals and county comparisons
| Hazard | Modeled annual loss | State share | VH / RH counties | Largest county | US state rank |
|---|---|---|---|---|---|
| Riverine Flood | $4.94 billion | 40.0% | 3 / 13 | Harris County, TX | #2 of 56 |
| Tornado | $2.37 billion | 19.2% | 9 / 38 | Collin County, TX | #1 of 56 |
| Hurricane | $1.27 billion | 10.3% | 5 / 12 | Harris County, TX | #5 of 56 |
| Cold Wave | $1.09 billion | 8.9% | 7 / 36 | Harris County, TX | #2 of 56 |
| Hail | $834.9 million | 6.8% | 12 / 27 | Dallas County, TX | #1 of 56 |
| Heat Wave | $797.4 million | 6.5% | 2 / 11 | Dallas County, TX | #2 of 56 |
| Drought | $411.2 million | 3.3% | 2 / 75 | Lubbock County, TX | #2 of 56 |
| Strong Wind | $190.1 million | 1.5% | 3 / 41 | Lubbock County, TX | #2 of 56 |
| Lightning | $127.8 million | 1.0% | 12 / 34 | Harris County, TX | #2 of 56 |
| Wildfire | $126.1 million | 1.0% | 0 / 0 | Parker County, TX | #9 of 56 |
| Ice Storm | $82.8 million | 0.7% | 13 / 30 | Red River County, TX | #3 of 56 |
| Earthquake | $48.3 million | 0.4% | 0 / 0 | Harris County, TX | #32 of 56 |
| Winter Weather | $33.7 million | 0.3% | 8 / 21 | El Paso County, TX | #1 of 56 |
| Coastal Flood | $17.4 million | 0.1% | 0 / 2 | Galveston County, TX | #16 of 56 |
| Landslide | $197,000 | 0.0% | 0 / 0 | Harris County, TX | #38 of 56 |
| Avalanche | $401 | 0.0% | 0 / 0 | Brewster County, TX | #24 of 56 |
Hazard shares show which modeled expected annual losses dominate the state total; ranks compare state totals for the same hazard.
Texas hazard totals combine the county estimates. The largest county column identifies concentration within each hazard; the state rank compares the same hazard across state-level entries.
Texas county loss totals
| County | Risk index rating | Modeled annual loss | Largest hazard |
|---|---|---|---|
| Harris County | Very High | $2.22 billion | Riverine Flood |
| Dallas County | Very High | $973.2 million | Riverine Flood |
| Collin County | Relatively High | $716.3 million | Tornado |
| Bexar County | Relatively High | $619.4 million | Riverine Flood |
| Tarrant County | Relatively High | $608.1 million | Riverine Flood |
| Travis County | Relatively High | $376.3 million | Riverine Flood |
| Denton County | Relatively High | $354.7 million | Tornado |
| Fort Bend County | Relatively High | $346.2 million | Riverine Flood |
| Hidalgo County | Relatively High | $309.8 million | Hurricane |
| Montgomery County | Relatively High | $221.9 million | Riverine Flood |
| Lubbock County | Relatively High | $213.5 million | Drought |
| Galveston County | Relatively High | $198.0 million | Riverine Flood |
| Nueces County | Relatively High | $186.1 million | Hurricane |
| Cameron County | Relatively High | $165.1 million | Hurricane |
| Brazoria County | Relatively Moderate | $161.5 million | Riverine Flood |
Show all 254 counties
| County | Risk index rating | Modeled annual loss | Largest hazard |
|---|---|---|---|
| Comal County | Relatively Moderate | $143.7 million | Riverine Flood |
| Jefferson County | Relatively High | $140.7 million | Hurricane |
| Williamson County | Relatively Moderate | $136.6 million | Riverine Flood |
| Guadalupe County | Relatively Moderate | $123.7 million | Riverine Flood |
| El Paso County | Relatively High | $120.8 million | Riverine Flood |
| Hays County | Relatively Moderate | $108.6 million | Riverine Flood |
| Bell County | Relatively Moderate | $107.0 million | Riverine Flood |
| McLennan County | Relatively Moderate | $84.5 million | Riverine Flood |
| Johnson County | Relatively Moderate | $70.7 million | Tornado |
| Randall County | Relatively Moderate | $70.4 million | Tornado |
| Potter County | Relatively Moderate | $63.4 million | Hail |
| Brazos County | Relatively Moderate | $62.7 million | Riverine Flood |
| Gregg County | Relatively Moderate | $54.6 million | Tornado |
| Orange County | Relatively Moderate | $54.3 million | Hurricane |
| Taylor County | Relatively Moderate | $53.7 million | Riverine Flood |
| Victoria County | Relatively Moderate | $53.4 million | Hurricane |
| Parker County | Relatively Moderate | $52.8 million | Tornado |
| Midland County | Relatively Moderate | $48.7 million | Riverine Flood |
| Parmer County | Relatively Moderate | $47.9 million | Drought |
| Ellis County | Relatively Moderate | $46.9 million | Riverine Flood |
| Webb County | Relatively Moderate | $46.5 million | Riverine Flood |
| Ector County | Relatively Moderate | $46.4 million | Riverine Flood |
| Rockwall County | Relatively Low | $46.4 million | Tornado |
| Hunt County | Relatively Moderate | $43.3 million | Tornado |
| Smith County | Relatively Moderate | $43.1 million | Riverine Flood |
| Kaufman County | Relatively Low | $42.7 million | Riverine Flood |
| Grayson County | Relatively Low | $42.6 million | Riverine Flood |
| Bastrop County | Relatively Moderate | $42.5 million | Riverine Flood |
| Wichita County | Relatively Moderate | $39.7 million | Riverine Flood |
| San Patricio County | Relatively Moderate | $39.5 million | Hurricane |
| Jim Wells County | Relatively Moderate | $38.2 million | Cold Wave |
| Henderson County | Relatively Moderate | $37.4 million | Cold Wave |
| Gonzales County | Relatively Moderate | $36.8 million | Riverine Flood |
| Kleberg County | Relatively Moderate | $35.3 million | Cold Wave |
| Wharton County | Relatively Moderate | $35.0 million | Hurricane |
| Erath County | Relatively Low | $33.9 million | Riverine Flood |
| Lavaca County | Relatively Low | $33.8 million | Riverine Flood |
| Bowie County | Relatively Low | $33.4 million | Riverine Flood |
| Matagorda County | Relatively Low | $33.3 million | Hurricane |
| Caldwell County | Relatively Low | $33.0 million | Riverine Flood |
| Liberty County | Relatively Low | $32.5 million | Riverine Flood |
| Nacogdoches County | Relatively Low | $32.0 million | Riverine Flood |
| Lamar County | Relatively Low | $31.9 million | Tornado |
| Wilson County | Relatively Low | $31.9 million | Riverine Flood |
| DeWitt County | Relatively Moderate | $31.4 million | Riverine Flood |
| Tom Green County | Relatively Low | $30.9 million | Riverine Flood |
| Hale County | Relatively Low | $30.9 million | Hail |
| Chambers County | Relatively Low | $30.4 million | Riverine Flood |
| Starr County | Relatively Moderate | $29.5 million | Cold Wave |
| Hood County | Relatively Low | $29.1 million | Riverine Flood |
| Harrison County | Relatively Low | $28.7 million | Riverine Flood |
| Cooke County | Relatively Low | $28.5 million | Riverine Flood |
| Hopkins County | Relatively Low | $27.9 million | Riverine Flood |
| Hardin County | Relatively Low | $27.1 million | Riverine Flood |
| Fannin County | Relatively Low | $26.9 million | Drought |
| Navarro County | Relatively Low | $26.5 million | Riverine Flood |
| Kendall County | Relatively Low | $26.1 million | Riverine Flood |
| Burnet County | Relatively Low | $25.8 million | Riverine Flood |
| Kerr County | Relatively Low | $25.3 million | Riverine Flood |
| Walker County | Relatively Low | $25.0 million | Riverine Flood |
| Hill County | Relatively Low | $24.7 million | Cold Wave |
| Polk County | Relatively Low | $24.5 million | Riverine Flood |
| Jackson County | Relatively Low | $24.0 million | Hurricane |
| Waller County | Relatively Low | $23.9 million | Riverine Flood |
| Val Verde County | Relatively Low | $23.6 million | Riverine Flood |
| Angelina County | Relatively Low | $23.4 million | Riverine Flood |
| Anderson County | Relatively Low | $23.2 million | Riverine Flood |
| Coryell County | Relatively Low | $22.9 million | Riverine Flood |
| Hutchinson County | Relatively Low | $22.3 million | Drought |
| Calhoun County | Relatively Low | $21.6 million | Hurricane |
| Upshur County | Relatively Low | $21.4 million | Riverine Flood |
| Willacy County | Relatively Low | $21.4 million | Cold Wave |
| Washington County | Relatively Low | $21.3 million | Riverine Flood |
| Medina County | Relatively Low | $20.5 million | Riverine Flood |
| Uvalde County | Relatively Low | $20.4 million | Riverine Flood |
| Moore County | Relatively Low | $20.3 million | Drought |
| Wise County | Relatively Low | $20.3 million | Riverine Flood |
| Van Zandt County | Relatively Low | $20.1 million | Riverine Flood |
| Deaf Smith County | Relatively Low | $19.8 million | Cold Wave |
| Brown County | Relatively Low | $19.3 million | Riverine Flood |
| Llano County | Relatively Low | $18.6 million | Riverine Flood |
| Gray County | Relatively Low | $18.4 million | Drought |
| Cherokee County | Relatively Low | $17.3 million | Riverine Flood |
| Fayette County | Relatively Low | $17.1 million | Riverine Flood |
| Bandera County | Relatively Low | $17.0 million | Riverine Flood |
| Gillespie County | Relatively Low | $17.0 million | Riverine Flood |
| Bee County | Relatively Low | $16.2 million | Hurricane |
| Colorado County | Relatively Low | $15.9 million | Riverine Flood |
| Red River County | Relatively Low | $15.6 million | Ice Storm |
| Montague County | Relatively Low | $15.6 million | Drought |
| Jasper County | Relatively Low | $15.5 million | Riverine Flood |
| Aransas County | Relatively Low | $15.2 million | Hurricane |
| Wood County | Relatively Low | $15.2 million | Riverine Flood |
| Leon County | Relatively Low | $15.1 million | Cold Wave |
| Lamb County | Relatively Low | $15.0 million | Hail |
| Rusk County | Relatively Low | $14.9 million | Riverine Flood |
| Palo Pinto County | Relatively Low | $14.7 million | Riverine Flood |
| Ochiltree County | Very Low | $14.5 million | Drought |
| Austin County | Relatively Low | $14.5 million | Riverine Flood |
| Grimes County | Relatively Low | $14.4 million | Riverine Flood |
| Dallam County | Relatively Low | $14.2 million | Drought |
| San Jacinto County | Relatively Low | $14.1 million | Riverine Flood |
| Tyler County | Relatively Low | $14.1 million | Riverine Flood |
| Hartley County | Very Low | $14.0 million | Drought |
| Atascosa County | Relatively Low | $13.9 million | Riverine Flood |
| Howard County | Relatively Low | $13.8 million | Riverine Flood |
| Hockley County | Relatively Low | $13.8 million | Hail |
| Brooks County | Relatively Low | $13.5 million | Cold Wave |
| Freestone County | Relatively Low | $13.4 million | Cold Wave |
| Maverick County | Relatively Low | $13.3 million | Riverine Flood |
| Houston County | Relatively Low | $13.1 million | Cold Wave |
| Limestone County | Relatively Low | $13.1 million | Cold Wave |
| Shelby County | Relatively Low | $12.9 million | Riverine Flood |
| Trinity County | Relatively Low | $12.9 million | Cold Wave |
| Gaines County | Relatively Low | $12.9 million | Cold Wave |
| Panola County | Relatively Low | $12.9 million | Riverine Flood |
| Milam County | Relatively Low | $12.6 million | Riverine Flood |
| Terry County | Relatively Low | $12.2 million | Cold Wave |
| Karnes County | Relatively Low | $12.0 million | Riverine Flood |
| Hansford County | Very Low | $12.0 million | Drought |
| Titus County | Relatively Low | $11.8 million | Riverine Flood |
| Lee County | Very Low | $11.7 million | Cold Wave |
| Carson County | Very Low | $11.5 million | Drought |
| Comanche County | Relatively Low | $11.0 million | Riverine Flood |
| Young County | Very Low | $10.8 million | Riverine Flood |
| Cass County | Relatively Low | $10.8 million | Riverine Flood |
| Sherman County | Very Low | $10.7 million | Drought |
| Frio County | Relatively Low | $10.7 million | Riverine Flood |
| Wilbarger County | Relatively Low | $10.6 million | Drought |
| Blanco County | Very Low | $10.1 million | Riverine Flood |
| Duval County | Relatively Low | $9.9 million | Cold Wave |
| Zavala County | Relatively Low | $9.8 million | Riverine Flood |
| Eastland County | Very Low | $9.5 million | Riverine Flood |
| Madison County | Very Low | $9.2 million | Cold Wave |
| Bosque County | Very Low | $9.1 million | Riverine Flood |
| Swisher County | Very Low | $9.1 million | Hail |
| Wheeler County | Very Low | $9.0 million | Drought |
| Jones County | Very Low | $8.9 million | Riverine Flood |
| Lipscomb County | Very Low | $8.7 million | Drought |
| Yoakum County | Relatively Low | $8.5 million | Riverine Flood |
| Dawson County | Very Low | $8.4 million | Cold Wave |
| Scurry County | Very Low | $8.3 million | Riverine Flood |
| Refugio County | Very Low | $7.9 million | Hurricane |
| Jim Hogg County | Relatively Low | $7.8 million | Cold Wave |
| Bailey County | Very Low | $7.8 million | Drought |
| Floyd County | Very Low | $7.8 million | Hail |
| Castro County | Very Low | $7.7 million | Hail |
| Real County | Very Low | $7.7 million | Riverine Flood |
| Somervell County | Very Low | $7.7 million | Riverine Flood |
| Lampasas County | Very Low | $7.7 million | Riverine Flood |
| Collingsworth County | Very Low | $7.5 million | Drought |
| Burleson County | Very Low | $7.5 million | Riverine Flood |
| Camp County | Very Low | $7.4 million | Tornado |
| Live Oak County | Very Low | $7.3 million | Cold Wave |
| Nolan County | Very Low | $7.3 million | Riverine Flood |
| Robertson County | Very Low | $7.2 million | Riverine Flood |
| Morris County | Very Low | $7.0 million | Tornado |
| Runnels County | Very Low | $7.0 million | Riverine Flood |
| Kenedy County | Very Low | $6.8 million | Cold Wave |
| Franklin County | Very Low | $6.8 million | Tornado |
| Brewster County | Very Low | $6.7 million | Riverine Flood |
| Hall County | Very Low | $6.7 million | Drought |
| Donley County | Very Low | $6.6 million | Drought |
| Armstrong County | Very Low | $6.4 million | Drought |
| Childress County | Very Low | $6.4 million | Drought |
| Goliad County | Very Low | $6.3 million | Hurricane |
| Kimble County | Very Low | $6.3 million | Riverine Flood |
| Dimmit County | Very Low | $6.3 million | Heat Wave |
| Hemphill County | Very Low | $6.2 million | Drought |
| Lynn County | Very Low | $6.1 million | Hail |
| Andrews County | Very Low | $6.0 million | Riverine Flood |
| Falls County | Very Low | $6.0 million | Riverine Flood |
| Briscoe County | Very Low | $5.9 million | Drought |
| Mitchell County | Very Low | $5.8 million | Riverine Flood |
| Pecos County | Very Low | $5.7 million | Riverine Flood |
| Clay County | Very Low | $5.7 million | Riverine Flood |
| Sabine County | Very Low | $5.7 million | Riverine Flood |
| Rains County | Very Low | $5.6 million | Tornado |
| Marion County | Very Low | $5.6 million | Riverine Flood |
| Zapata County | Very Low | $5.5 million | Cold Wave |
| Newton County | Very Low | $5.5 million | Riverine Flood |
| Martin County | Very Low | $5.5 million | Riverine Flood |
| Reeves County | Very Low | $5.5 million | Riverine Flood |
| Jack County | Very Low | $5.5 million | Riverine Flood |
| Coleman County | Very Low | $5.0 million | Riverine Flood |
| Hamilton County | Very Low | $4.9 million | Riverine Flood |
| Callahan County | Very Low | $4.8 million | Riverine Flood |
| Garza County | Very Low | $4.7 million | Drought |
| Stephens County | Very Low | $4.6 million | Riverine Flood |
| Crosby County | Very Low | $4.6 million | Drought |
| Haskell County | Very Low | $4.4 million | Riverine Flood |
| La Salle County | Very Low | $4.3 million | Cold Wave |
| Oldham County | Very Low | $4.2 million | Drought |
| Baylor County | Very Low | $4.2 million | Drought |
| Ward County | Very Low | $4.1 million | Riverine Flood |
| Knox County | Very Low | $4.1 million | Drought |
| Delta County | Very Low | $4.1 million | Tornado |
| Cochran County | Very Low | $4.0 million | Drought |
| Archer County | Very Low | $3.9 million | Riverine Flood |
| San Augustine County | Very Low | $3.9 million | Riverine Flood |
| McCulloch County | Very Low | $3.7 million | Riverine Flood |
| Dickens County | Very Low | $3.5 million | Drought |
| Roberts County | Very Low | $3.4 million | Drought |
| Crockett County | Very Low | $3.4 million | Riverine Flood |
| Mason County | Very Low | $3.3 million | Riverine Flood |
| San Saba County | Very Low | $3.3 million | Riverine Flood |
| Cottle County | Very Low | $3.2 million | Drought |
| Upton County | Very Low | $3.1 million | Drought |
| Reagan County | Very Low | $3.0 million | Drought |
| Fisher County | Very Low | $2.9 million | Drought |
| Culberson County | Very Low | $2.8 million | Drought |
| Borden County | Very Low | $2.7 million | Drought |
| Glasscock County | Very Low | $2.6 million | Drought |
| Presidio County | Very Low | $2.6 million | Riverine Flood |
| Hardeman County | Very Low | $2.5 million | Drought |
| Sutton County | Very Low | $2.5 million | Riverine Flood |
| Concho County | Very Low | $2.4 million | Drought |
| Winkler County | Very Low | $2.4 million | Drought |
| Shackelford County | Very Low | $2.4 million | Riverine Flood |
| Foard County | Very Low | $2.3 million | Drought |
| Throckmorton County | Very Low | $2.3 million | Drought |
| Coke County | Very Low | $2.3 million | Riverine Flood |
| Schleicher County | Very Low | $2.3 million | Drought |
| Mills County | Very Low | $2.2 million | Riverine Flood |
| Edwards County | Very Low | $2.0 million | Riverine Flood |
| Stonewall County | Very Low | $2.0 million | Drought |
| Menard County | Very Low | $2.0 million | Riverine Flood |
| Jeff Davis County | Very Low | $1.9 million | Wildfire |
| Motley County | Very Low | $1.8 million | Drought |
| Hudspeth County | Very Low | $1.7 million | Drought |
| Sterling County | Very Low | $1.5 million | Drought |
| Kent County | Very Low | $1.4 million | Drought |
| Irion County | Very Low | $1.3 million | Wildfire |
| Kinney County | Very Low | $1.3 million | Riverine Flood |
| Crane County | Very Low | $971,000 | Riverine Flood |
| McMullen County | Very Low | $875,000 | Riverine Flood |
| Terrell County | Very Low | $545,000 | Riverine Flood |
| King County | Very Low | $401,000 | Riverine Flood |
| Loving County | Very Low | $58,000 | Riverine Flood |
Texas population, values and ratings
- Population
- 29,099,690
- Building value
- $5,293.83 billion
- Agricultural value
- $32.09 billion
- Modeled loss per resident
- $424
Overall county risk ratings
- Very Low: 113
- Relatively Low: 92
- Relatively Moderate: 33
- Relatively High: 14
- Very High: 2
Texas overall ratings describe relative county risk. Segment widths count counties, rather than residents or modeled dollars.
View chart data
| Rating | Count |
|---|---|
| Very Low | 113 |
| Relatively Low | 92 |
| Relatively Moderate | 33 |
| Relatively High | 14 |
| Very High | 2 |
Texas county pages
Texas has 2 detailed county pages linked below.
Questions about Texas
Which Texas county has the largest modeled loss?
Harris County, TX leads Texas, with about $2.22 billion in modeled expected annual loss.
Which hazard leads modeled loss in Texas?
Riverine flooding leads Texas, at about $4.94 billion annually.
What total loss does FEMA model for Texas?
Texas has about $12.35 billion in modeled expected annual loss.
What share of national loss belongs to Texas?
The state accounts for 8.0% of national modeled loss.
How many counties appear in the Texas table?
The Texas table contains 254 counties and county equivalents.
Where does Texas rank by modeled loss?
Texas places #2 of 56 state-level entries by modeled expected annual loss.
Does the Texas estimate predict next year?
The Texas figure is a long-run modeled annual average, rather than a forecast for any single year.
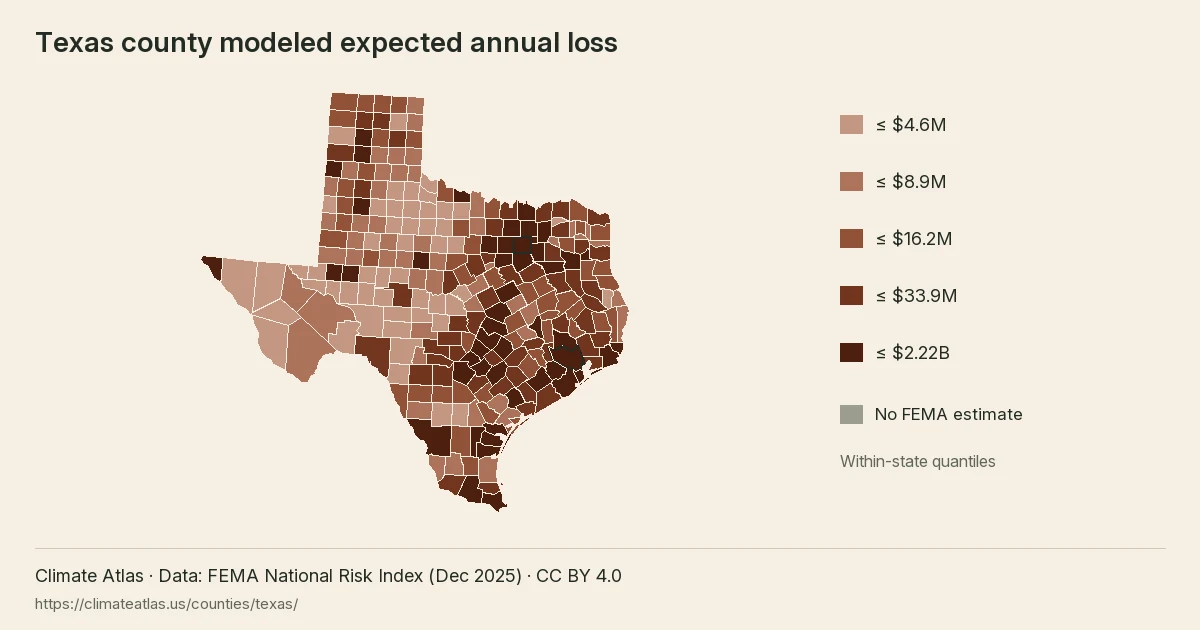
Texas county modeled expected annual loss, in five within-state quantile classes.