Suffolk County, MA flood risk and natural hazards
FEMA rates none of the 7 reviewed hazards as Very High in Suffolk County, MA. Modeled losses from natural hazards (expected annual loss) average about $115 million a year, for a population of 796,326. These county figures come from the FEMA National Risk Index, December 2025 release. Observation windows vary by metric and sit beside the tables below.
- Modeled expected annual loss
- $114.9 million / year
- US loss rank
- #262 of 3,232
- State loss rank
- #5 of 14
- Loss per resident
- $144 · state $210 · US $459
- FEMA overall risk rating
- Relatively Moderate
Massachusetts county modeled loss
- Positive estimates to $22.9 million
- Above $22.9 million to $82.3 million
- Above $82.3 million to $114.3 million
- Above $114.3 million to $162.8 million
- Above $162.8 million to $321.9 million
- No FEMA estimate
Suffolk County, MA ranks #5 of 14 in the state for modeled expected annual loss; the outline locates it.
View chart data
Is Suffolk County at risk of flooding?
FEMA labels riverine flooding Relatively High and coastal flooding Relatively High. Modeled annual riverine flood loss is $59,518,167; coastal flood loss is $6,288,266. These are separate hazards and county totals. A rating describes relative county risk. It does not locate water at a building or establish a flood zone. Read missing statuses using the source documentation. Keep both source labels when comparing counties. Read the county rating versus flood-zone guide before requesting a location check.
Look up an address and its flood zone through FEMA’s Flood Map Service Center.
The local hazard planning document is City of Boston Natural Hazard Mitigation Plan. Suffolk County has no county-level plan. Local governments use this plan to set out hazards and proposed projects.
What natural hazards affect Suffolk County most?
Show tabular data
| County | Modeled expected annual loss (USD/year) | Overall risk rating |
|---|---|---|
| Suffolk County, MA | 114,876,837.32 | Relatively Moderate |
Show tabular data
| Hazard | Source label | Observation window |
|---|---|---|
| Coastal flooding | Relatively High | 1996-2023 |
| Riverine flooding | Relatively High | 1996-2023 |
| Hurricane | Relatively High | 1851-2024 |
| Wildfire | Very Low | 1996-2023 |
| Earthquake | Relatively Moderate | 1996-2023 |
| Tornado | Relatively Moderate | 1950-2023 |
| Heat wave | Relatively High | 2005-2024 |
How have heat and rain changed in Suffolk County?
Hot days
Hot days increased between the two decades.
View chart data
| Place | Days / year |
|---|---|
| 1991–2000 | 0.90 |
| 2016–2025 | 1.20 |
Warm nights
Warm nights increased between the two decades.
View chart data
| Place | Days / year |
|---|---|
| 1991–2000 | 0.00 |
| 2016–2025 | 0.10 |
Heavy-precipitation days
Heavy-precipitation days increased between the two decades.
View chart data
| Place | Days / year |
|---|---|
| 1991–2000 | 1.20 |
| 2016–2025 | 1.30 |
Humid-heat days
Humid-heat days increased between the two decades.
View chart data
| Place | Days / year |
|---|---|
| 1991–2000 | 0.10 |
| 2016–2025 | 0.20 |
| Measure | 1991–2000 | 2016–2025 | Change |
|---|---|---|---|
| Hot days · ≥35°C (95°F) | 0.9 | 1.2 | +0.3 |
| Humid-heat days · heat index ≥103°F (39.4°C) | 0.1 | 0.2 | +0.1 |
| Warm nights · ≥24°C (75.2°F) | 0.0 | 0.1 | +0.1 |
| Heavy-rain days · ≥50 mm (≈2 in) | 1.2 | 1.3 | +0.1 |
| Annual maximum daily precipitation · mm | 66.9 | 56.1 | −10.8 |
Counts are days per year; a grid-cell zero does not mean the county had no such events. Thresholds, time bases and limits: county climate method.
Methodology & sensor cross-check notes
Hot-day cross-check: NOAA’s county-average daily maximum temperature gives 0.6 → 2.5 hot days a year (+1.9); NASA gives 0.9 → 1.2 (+0.3). Both series show an increase, with different counts and change sizes. The footprints differ, so agreement does not validate either count. Warm nights and precipitation were not cross-checked. Humid-heat row: Copernicus (ECMWF) reanalysis. It uses a different regional grid from the NASA measures.
No statistical significance, cause or future trend is established; this does not change the FEMA ratings above.
Climate data: NASA · Population context: US Census Bureau · Hot-day cross-check: NOAA county climate records · Humid heat: Copernicus (ECMWF). Method, sources and limitations · Climate JSON · Data credits.
{"fips":"25025","name":"Suffolk","state":"Massachusetts","annual":[{"year":1991,"valid_days":365,"hot_days":2,"humid_heat_days":0,"warm_nights":0,"heavy_rain_days":3,"annual_max_rain":93.63},{"year":1992,"valid_days":366,"hot_days":0,"humid_heat_days":0,"warm_nights":0,"heavy_rain_days":0,"annual_max_rain":47.31},{"year":1993,"valid_days":365,"hot_days":2,"humid_heat_days":0,"warm_nights":0,"heavy_rain_days":0,"annual_max_rain":47.05},{"year":1994,"valid_days":365,"hot_days":0,"humid_heat_days":0,"warm_nights":0,"heavy_rain_days":1,"annual_max_rain":73.58},{"year":1995,"valid_days":365,"hot_days":2,"humid_heat_days":0,"warm_nights":0,"heavy_rain_days":0,"annual_max_rain":47.96},{"year":1996,"valid_days":366,"hot_days":0,"humid_heat_days":0,"warm_nights":0,"heavy_rain_days":4,"annual_max_rain":133.82},{"year":1997,"valid_days":365,"hot_days":0,"humid_heat_days":0,"warm_nights":0,"heavy_rain_days":0,"annual_max_rain":46.36},{"year":1998,"valid_days":365,"hot_days":0,"humid_heat_days":0,"warm_nights":0,"heavy_rain_days":2,"annual_max_rain":67.78},{"year":1999,"valid_days":365,"hot_days":3,"humid_heat_days":1,"warm_nights":0,"heavy_rain_days":2,"annual_max_rain":69.03},{"year":2000,"valid_days":366,"hot_days":0,"humid_heat_days":0,"warm_nights":0,"heavy_rain_days":0,"annual_max_rain":42.66},{"year":2001,"valid_days":365,"hot_days":2,"humid_heat_days":null,"warm_nights":0,"heavy_rain_days":2,"annual_max_rain":69.42},{"year":2002,"valid_days":365,"hot_days":9,"humid_heat_days":null,"warm_nights":0,"heavy_rain_days":0,"annual_max_rain":41.58},{"year":2003,"valid_days":365,"hot_days":0,"humid_heat_days":null,"warm_nights":0,"heavy_rain_days":0,"annual_max_rain":39.77},{"year":2004,"valid_days":366,"hot_days":0,"humid_heat_days":null,"warm_nights":0,"heavy_rain_days":2,"annual_max_rain":55.4},{"year":2005,"valid_days":365,"hot_days":0,"humid_heat_days":null,"warm_nights":0,"heavy_rain_days":3,"annual_max_rain":90.6},{"year":2006,"valid_days":365,"hot_days":0,"humid_heat_days":null,"warm_nights":1,"heavy_rain_days":4,"annual_max_rain":71.75},{"year":2007,"valid_days":365,"hot_days":2,"humid_heat_days":null,"warm_nights":0,"heavy_rain_days":0,"annual_max_rain":49.47},{"year":2008,"valid_days":366,"hot_days":0,"humid_heat_days":null,"warm_nights":0,"heavy_rain_days":3,"annual_max_rain":80.61},{"year":2009,"valid_days":365,"hot_days":0,"humid_heat_days":null,"warm_nights":0,"heavy_rain_days":1,"annual_max_rain":51.38},{"year":2010,"valid_days":365,"hot_days":0,"humid_heat_days":null,"warm_nights":0,"heavy_rain_days":3,"annual_max_rain":92.41},{"year":2011,"valid_days":365,"hot_days":1,"humid_heat_days":null,"warm_nights":0,"heavy_rain_days":1,"annual_max_rain":54.35},{"year":2012,"valid_days":366,"hot_days":1,"humid_heat_days":null,"warm_nights":0,"heavy_rain_days":0,"annual_max_rain":42.79},{"year":2013,"valid_days":365,"hot_days":0,"humid_heat_days":null,"warm_nights":0,"heavy_rain_days":2,"annual_max_rain":53.58},{"year":2014,"valid_days":365,"hot_days":0,"humid_heat_days":null,"warm_nights":0,"heavy_rain_days":2,"annual_max_rain":61.96},{"year":2015,"valid_days":365,"hot_days":0,"humid_heat_days":null,"warm_nights":0,"heavy_rain_days":1,"annual_max_rain":65.15},{"year":2016,"valid_days":366,"hot_days":1,"humid_heat_days":2,"warm_nights":0,"heavy_rain_days":0,"annual_max_rain":38.94},{"year":2017,"valid_days":365,"hot_days":0,"humid_heat_days":0,"warm_nights":0,"heavy_rain_days":0,"annual_max_rain":46.42},{"year":2018,"valid_days":365,"hot_days":0,"humid_heat_days":0,"warm_nights":0,"heavy_rain_days":3,"annual_max_rain":61.11},{"year":2019,"valid_days":365,"hot_days":0,"humid_heat_days":0,"warm_nights":1,"heavy_rain_days":0,"annual_max_rain":45.2},{"year":2020,"valid_days":366,"hot_days":2,"humid_heat_days":0,"warm_nights":0,"heavy_rain_days":1,"annual_max_rain":54.37},{"year":2021,"valid_days":365,"hot_days":0,"humid_heat_days":0,"warm_nights":0,"heavy_rain_days":2,"annual_max_rain":84.01},{"year":2022,"valid_days":365,"hot_days":5,"humid_heat_days":0,"warm_nights":0,"heavy_rain_days":0,"annual_max_rain":48.52},{"year":2023,"valid_days":365,"hot_days":0,"humid_heat_days":0,"warm_nights":0,"heavy_rain_days":3,"annual_max_rain":68.41},{"year":2024,"valid_days":366,"hot_days":0,"humid_heat_days":0,"warm_nights":0,"heavy_rain_days":4,"annual_max_rain":64.65},{"year":2025,"valid_days":365,"hot_days":4,"humid_heat_days":0,"warm_nights":0,"heavy_rain_days":0,"annual_max_rain":49.82}],"metrics":{"hot_days":{"baseline":0.9,"recent":1.2,"delta":0.3},"humid_heat_days":{"baseline":0.1,"recent":0.2,"delta":0.1},"warm_nights":{"baseline":0,"recent":0.1,"delta":0.1},"heavy_rain_days":{"baseline":1.2,"recent":1.3,"delta":0.1},"annual_max_rain":{"baseline":66.918,"recent":56.145,"delta":-10.773}},"crosscheck":{"metric":"hot_days","annual":[{"year":1991,"hot_days":2},{"year":1992,"hot_days":0},{"year":1993,"hot_days":2},{"year":1994,"hot_days":0},{"year":1995,"hot_days":1},{"year":1996,"hot_days":0},{"year":1997,"hot_days":0},{"year":1998,"hot_days":0},{"year":1999,"hot_days":1},{"year":2000,"hot_days":0},{"year":2016,"hot_days":2},{"year":2017,"hot_days":1},{"year":2018,"hot_days":2},{"year":2019,"hot_days":2},{"year":2020,"hot_days":3},{"year":2021,"hot_days":1},{"year":2022,"hot_days":9},{"year":2023,"hot_days":0},{"year":2024,"hot_days":1},{"year":2025,"hot_days":4}],"baseline":0.6,"recent":2.5,"delta":1.9,"agreement":"same direction"}}How does El Niño affect Suffolk County winters?
Strong El Niño winter precipitation
7 of 9 strong El Niño winters were wetter than normal. The vertical line marks 100% of normal precipitation.
View chart data
| Winter | Precipitation (% of normal) |
|---|---|
| 1957–58 | 168.630 |
| 1965–66 | 87.711 |
| 1972–73 | 106.985 |
| 1982–83 | 100.250 |
| 1991–92 | 67.258 |
| 1997–98 | 124.803 |
| 2009–10 | 109.507 |
| 2015–16 | 103.412 |
| 2023–24 | 138.068 |
NOAA and IRI both give 100% odds that El Niño conditions (tropical Pacific ONI of at least 0.5°C, not a local weather forecast) are present this winter. In Suffolk County, 7 of 9 past strong El Niño winters were wetter than normal; the median winter had 107% of normal precipitation (rain and melted snow). The driest, 1991–92, had 67%.
| Winter | ONI | Precipitation | Temp. | Heavy days | Claims |
|---|---|---|---|---|---|
| 1957–58 | 1.7 | 169% | +2.3°F | 7 | — |
| 1965–66 | 1.6 | 88% | +0.9°F | 3 | — |
| 1972–73 | 1.8 | 107% | +0.9°F | 3 | — |
| 1982–83 | 2.1 | 100% | +2.7°F | 6 | 5 (#17) |
| 1991–92 | 1.5 | 67% | +1.0°F | 1 | 1 (#36) |
| 1997–98 | 2.4 | 125% | +3.0°F | 4 | 10 (#12) |
| 2009–10 | 1.5 | 110% | −0.9°F | 4 | 5 (#17) |
| 2015–16 | 2.6 | 103% | +4.6°F | 2 | 0 |
| 2023–24 | 2.0 | 138% | +3.2°F | 4 | 18 (#8) |
Winter normals and temperature baseline
Suffolk County normals, 1990–91 to 2019–20 winters: 11.9 inches of precipitation (rain and melted snow) and 2.6 heavy days. Temperature is set against the county’s own winter trend of +0.7°F per decade since 1951–52.
Flood claims: December–February, from 1978 (— = before the data). The rank compares each winter with all 47 winters from 1978–79 to 2024–25 (#1 is the most claims; no rank is shown for 0 claims). The median winter had 4 claims; 4 of 6 strong winters in the data were above it. Insured exposure grew over time, so counts are not comparable across decades.
Past tendency is not a forecast and not a property-level finding. Before winter: four checks for property teams.
Sources: NOAA county climate records and Pacific climate assessments; FEMA National Flood Insurance Program claims. Method and limits · El Niño 2026–27.
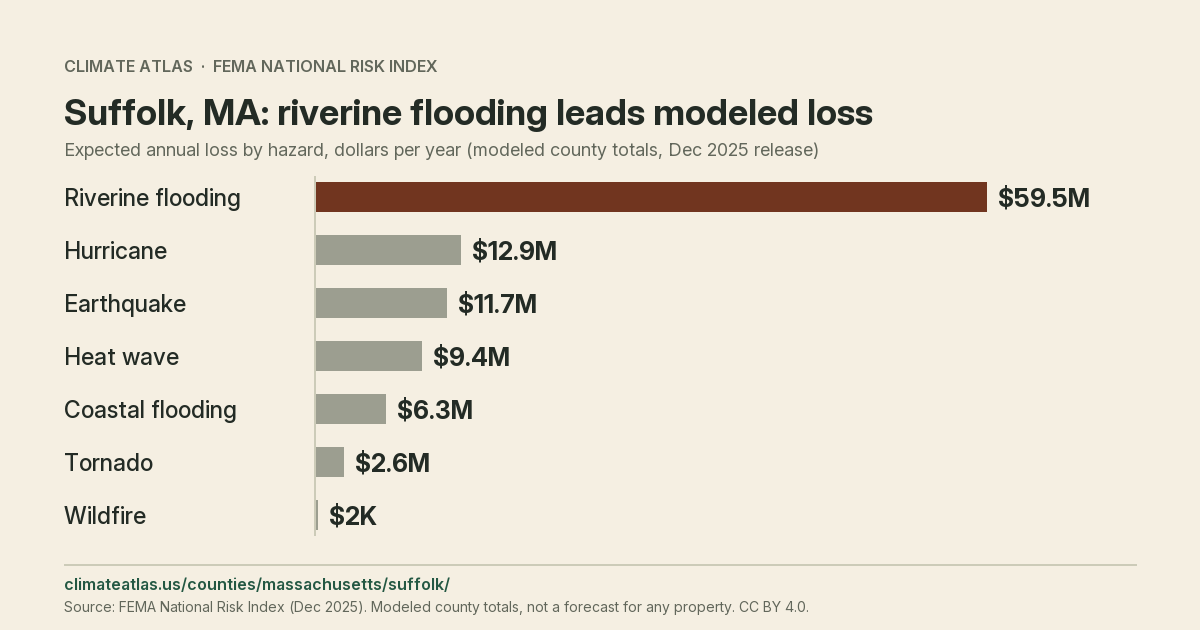
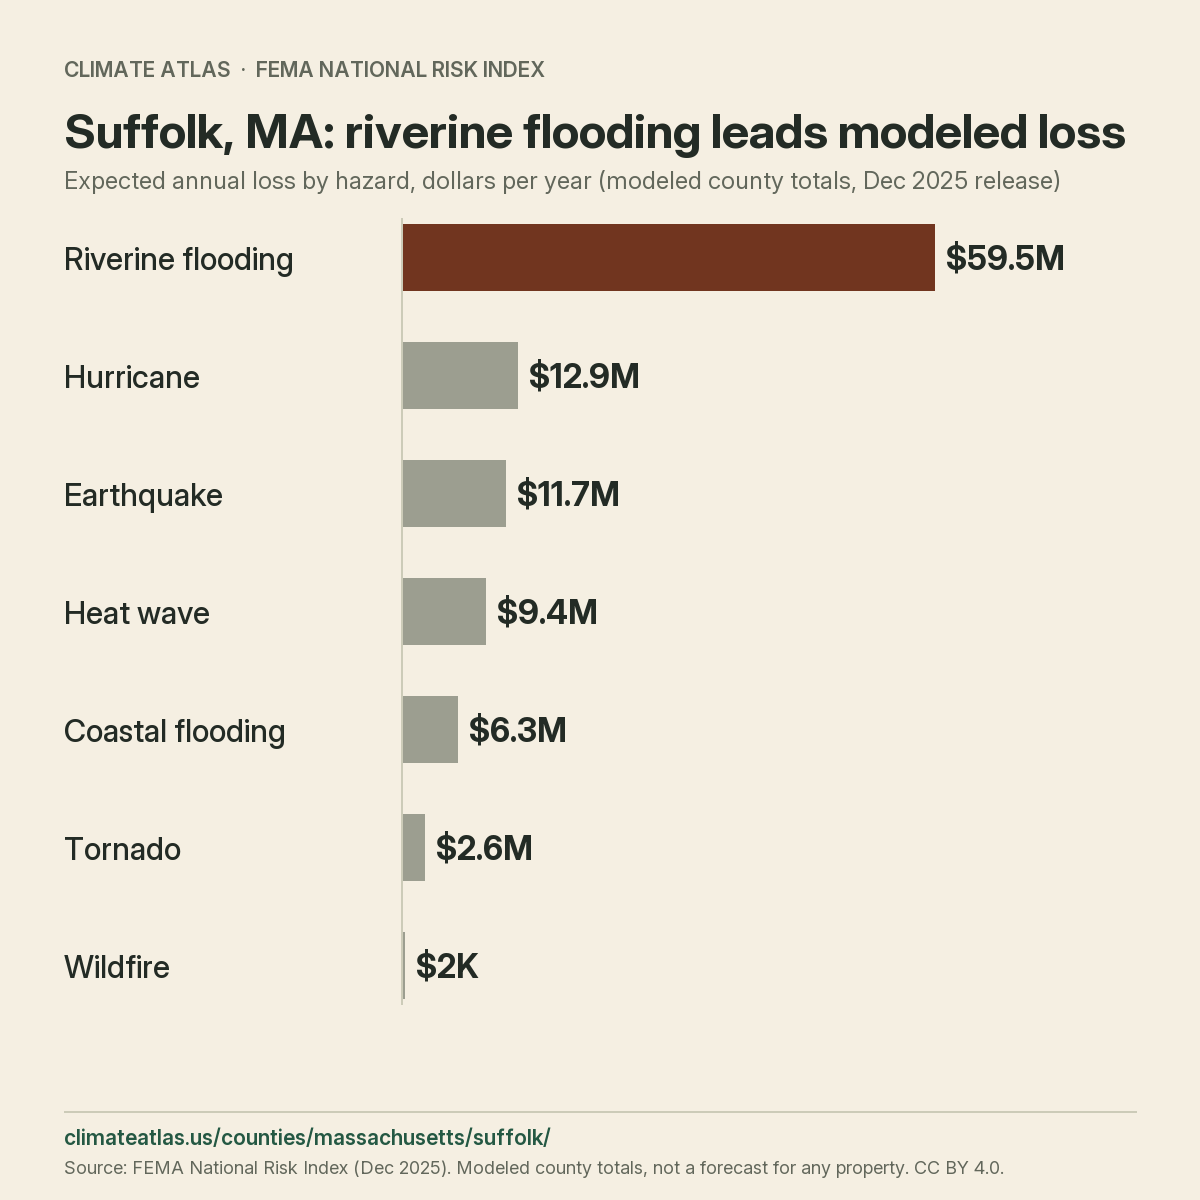
What are the modeled losses by hazard?
From 1991–2000 to 2016–2025, hot days near Suffolk County changed from 0.9 to 1.2 per year. Heavy-rain days changed from 1.2 to 1.3. The table retains humid heat, warm nights and maximum daily rain. Compare the periods alongside the source notes. These decade means describe past conditions; they do not predict a future year or establish a trend.
Suffolk County’s modeled loss across all hazards is $114,876,837 per year. The FEMA National Risk Index ranks the hazards below by modeled loss, not rating category.
Show tabular data
| Hazard | Total loss ($/yr) | Of which buildings ($/yr) | Observation window |
|---|---|---|---|
| All hazards (composite) | $114,876,837 | $88,962,750 | 1996-2023 |
| Riverine flooding | $59,518,167 | $59,469,894 | 1996-2023 |
| Hurricane | $12,923,252 | $12,415,981 | 1851-2024 |
| Earthquake | $11,650,421 | $8,238,651 | 1996-2023 |
| Heat wave | $9,433,776 | Not published | 2005-2024 |
| Coastal flooding | $6,288,266 | $5,228,356 | 1996-2023 |
| Tornado | $2,596,006 | $2,217,516 | 1950-2023 |
| Wildfire | $2,366 | $2,076 | 1996-2023 |
These modeled county totals do not estimate property losses, insurance inputs or forecasts. Do not multiply them by location counts.
Reuse this chart
What is exposed in Suffolk County?
Population and asset values show the scale behind county losses. These county totals are exposure measures, not loss figures.
Show tabular data
| Measure | Value | Observation window |
|---|---|---|
| Resident population | 796,326 | 2020-2020 |
| Building replacement value | $133,088,168,367 | 2020-2020 |
| Agricultural market value | $670,845 | 2022-2022 |
What do vulnerability and resilience show?
These relative rankings describe susceptibility to hazard impacts and capacity to recover. They measure no individual asset or outcome.
Show tabular data
| Measure | Score | Observation window |
|---|---|---|
| Social vulnerability index | 70.6 | 2020-2020 |
| Community resilience index | 95.5 | 2020-2020 |
Suffolk County in the state and national rankings
National placement for Suffolk County is #262 of 3,232, with an expected annual loss estimate of about $114.9 million. A #5 of 14 state ranking accompanies its 7.8% share of the Massachusetts loss total. The modeled $114.9 million annual average does not predict the loss in any single year. Lancaster County, NE ranks immediately above it, with about $115.4 million in modeled annual loss. The next lower national total is about $114.8 million, in Sangamon County, IL. The next higher total within Massachusetts belongs to Norfolk County, MA, at about $146.9 million. That puts the estimates about $32.0 million apart, with 9.9% of state loss in the comparison county. The next lower total within Massachusetts belongs to Plymouth County, MA, at about $114.3 million. The dollar gap is about $564,000; that county accounts for 7.7% of statewide modeled loss.
County hazard loss mix
Riverine Flood leads the modeled expected annual loss mix; bar lengths share a zero baseline.
View chart data
| Hazard | USD / year | Share |
|---|---|---|
| Riverine Flood | 59,518,166.67 | 51.8% |
| Hurricane | 12,923,251.78 | 11.2% |
| Earthquake | 11,650,420.50 | 10.1% |
| Heat Wave | 9,433,776.46 | 8.2% |
| Cold Wave | 8,678,434.88 | 7.6% |
| Coastal Flood | 6,288,266.39 | 5.5% |
| Other | 6,384,520.63 | 5.6% |
National hazard loss ranks
Riverine Flood ranks #214 of 3,232 by modeled expected annual loss. Higher percentiles mean larger modeled losses.
View chart data
| Hazard | Rank | Percentile |
|---|---|---|
| Riverine Flood | #214 of 3,232 US · #8 of 14 in MA | 93.41 |
| Hurricane | #201 of 2,485 US · #7 of 14 in MA | 91.95 |
| Earthquake | #190 of 3,232 US · #3 of 14 in MA | 94.15 |
| Heat Wave | #94 of 3,202 US · #1 of 14 in MA | 97.10 |
| Cold Wave | #238 of 3,232 US · #3 of 14 in MA | 92.67 |
| Coastal Flood | #48 of 588 US · #4 of 9 in MA | 92.01 |
Modeled loss per resident
Suffolk has about $144 in modeled expected annual loss per resident. State and US values divide total loss by total population.
View chart data
| Place | USD / resident / year |
|---|---|
| Suffolk | 144.26 |
| Massachusetts | 210.49 |
| US | 459.35 |
Suffolk County hazard estimates
Riverine Flood
The national loss rank for riverine flooding is #214 of 3,232, based on about $59.5 million in modeled expected annual loss. Its 51.8% share of total loss comes with a state loss rank of #8 of 14; FEMA assigns a Relatively High rating; for riverine flooding, 7 state counties and 186 US counties share that label.
Hurricane
With about $12.9 million in modeled expected annual loss from hurricanes, the county ranks #201 of 2,485 in the national comparison. In Massachusetts, this estimate ranks #7 of 14 and represents 11.2% of the county’s modeled loss; FEMA assigns a Relatively High rating; the Relatively High label covers 6 state counties and 118 nationally for hurricanes.
Earthquake
The national loss rank for earthquakes is #190 of 3,232, based on about $11.7 million in modeled expected annual loss. This hazard makes up 10.1% of the total; FEMA assigns a Relatively Moderate rating, and its loss ranks #3 of 14 in Massachusetts; for earthquakes, 5 state counties and 250 US counties share that label.
Heat Wave
With about $9.4 million in modeled expected annual loss from heat waves, the county ranks #94 of 3,202 in the national comparison. Its 8.2% share of total loss comes with a state loss rank of #1 of 14; FEMA assigns a Relatively High rating; for heat waves, 1 state county and 98 US counties share that label.
Cold Wave
With about $8.7 million in modeled expected annual loss from cold waves, the county ranks #238 of 3,232 in the national comparison. In Massachusetts, this estimate ranks #3 of 14 and represents 7.6% of the county’s modeled loss; FEMA assigns a Relatively High rating, matching 302 US counties, including 3 in Massachusetts, for this hazard.
Coastal Flood
The national loss rank for coastal flooding is #48 of 588, based on about $6.3 million in modeled expected annual loss. Its 5.5% share of total loss comes with a state loss rank of #4 of 9; FEMA assigns a Relatively High rating; the Relatively High label covers 2 state counties and 60 nationally for coastal flooding.
Between riverine flooding and hurricanes, the modeled dollar gap is about $46.6 million; their shares differ by 40.6 percentage points. Between hurricanes and earthquakes, the modeled dollar gap is about $1.3 million; their shares differ by 1.1 percentage points. About $2.2 million separates earthquakes from heat waves in the local estimates, equivalent to 1.9 percentage points of county loss. The loss estimate for heat waves exceeds cold waves by about $755,000, equivalent to 0.7 percentage points of total loss. Between cold waves and coastal flooding, the modeled dollar gap is about $2.4 million; their shares differ by 2.1 percentage points.
Population and recorded values
FEMA counts 796,326 residents in Suffolk County, across about 121 square miles. About $133.09 billion is the building value amount in FEMA’s record. The recorded agricultural value is about $671,000. Total modeled loss averages about $144 per resident annually, compared with about $210 statewide. Its 11.3% share of state residents sits alongside 7.8% of of annual loss. Buildings account for 9.3% of recorded Massachusetts building value. By recorded residents per square mile, the county places 1 among 14 Massachusetts county records with population and area values. Those recorded totals give about 6,558 residents per square mile, versus about 659 across Massachusetts. The median county population in Massachusetts is about 497,824, compared with 796,326 locally. The county’s national shares are 0.2% for population and 0.1% for modeled loss. Per-person modeled loss is about $144 locally; the corresponding US average comes to about $459. About $108.5 million of annual loss falls within the six leading hazards, accounting for 94.4% of the total. The balance outside those six estimates is about $6.4 million, or 5.6% of total loss. The estimate for tornadoes ranks #6 of 14 in Massachusetts: about $2.6 million annually, in local position 7. Its national loss rank is #857 of 3,225, and it represents 2.3% of the county’s modeled loss. The county’s number 8 hazard by dollar loss is lightning: about $2.3 million, with a state rank of #2 of 14. This 2.0% slice of county loss ranks #104 of 3,222 across US counties.
FEMA labels and risk score
Suffolk County has a FEMA risk index score of about 93.5, ranking #205 of 3,144 nationally. The risk index rating is Relatively Moderate, a label shared by 8 of 14 Massachusetts counties. FEMA labels expected annual loss as Relatively Moderate, matching 7 county records across Massachusetts. For social vulnerability, FEMA assigns Relatively High; 2 counties in Massachusetts have that label. For community resilience, FEMA assigns Very High; 13 counties in Massachusetts have that label. Its risk score ranks #4 of 14 within Massachusetts, while its loss total ranks #5 of 14. The Relatively High vulnerability and Very High resilience pairing appears in 1 Massachusetts counties. Those counties together hold 7.8% of Massachusetts modeled loss, including this county’s 100.0% share of their total. On the state risk-score list, Worcester County, MA sits immediately above, scoring about 93.5 and ranking #3 of 14. Its share of statewide modeled loss is 11.0%; FEMA’s risk index label there is Relatively Moderate. Hampden County, MA is next below it by state risk score, at about 92.8; that record ranks #5 of 14. For that neighboring score, the risk index category is Relatively Moderate, and the county’s state loss share is 7.2%. Across the US, this social vulnerability category, Relatively High, covers 15.4% of residents in 630 counties. Across the US, this community resilience category, Very High, covers 27.2% of residents in 629 counties. Across the county’s hazard ratings, 1 carry Very High: lightning. The county’s Relatively High group contains 5 hazards: coastal flooding, cold waves, heat waves, hurricanes, riverine flooding. Across the county’s hazard ratings, 5 carry Relatively Moderate: earthquakes, hail, ice storms, strong wind, tornadoes. FEMA assigns Relatively Low to 1 hazard here, covering winter weather. Across the county’s hazard ratings, 2 carry Very Low: landslides, wildfires.
What else should I know about Suffolk County?
What does FEMA estimate for wildfires in Suffolk County?
For wildfires, FEMA lists Suffolk County at Very Low, with about $2,000 in modeled expected annual loss.
What does FEMA estimate for winter weather in Suffolk County?
Suffolk County has about $43,000 in modeled expected annual loss from winter weather, with a Relatively Low rating.
What does FEMA estimate for coastal flooding in Suffolk County?
Suffolk County has about $6.3 million in modeled expected annual loss from coastal flooding, with a Relatively High rating.
What is the FEMA risk index rating for Suffolk County?
FEMA assigns Suffolk County a Relatively Moderate risk index rating.
Which hazard has the largest modeled loss in Suffolk County?
Riverine flooding leads Suffolk County, at about $59.5 million in modeled expected annual loss.
What does FEMA estimate for hail in Suffolk County?
For hail, FEMA lists Suffolk County at Relatively Moderate, with about $615,000 in modeled expected annual loss.
What building value does FEMA list for Suffolk County?
FEMA records about $133.09 billion of building value in Suffolk County.
Where next for Suffolk County?
See how the county compares across the state in Massachusetts natural hazard risk by county, download the FEMA county hazard data, or review the county climate risk data API and bulk files. Check the sources and what each measure can show on the methodology page.